
Meta Incident Management
* Please be aware this page is not linked on the main home page
Tasks
UX, UI, Research, Product strategy
Time
Apr 2020 – Oct 2021
I lead design and product initiatives building tools and introduced systems that helped software engineers record incidents, and efficiently collaborate to quickly mitigate system failures.
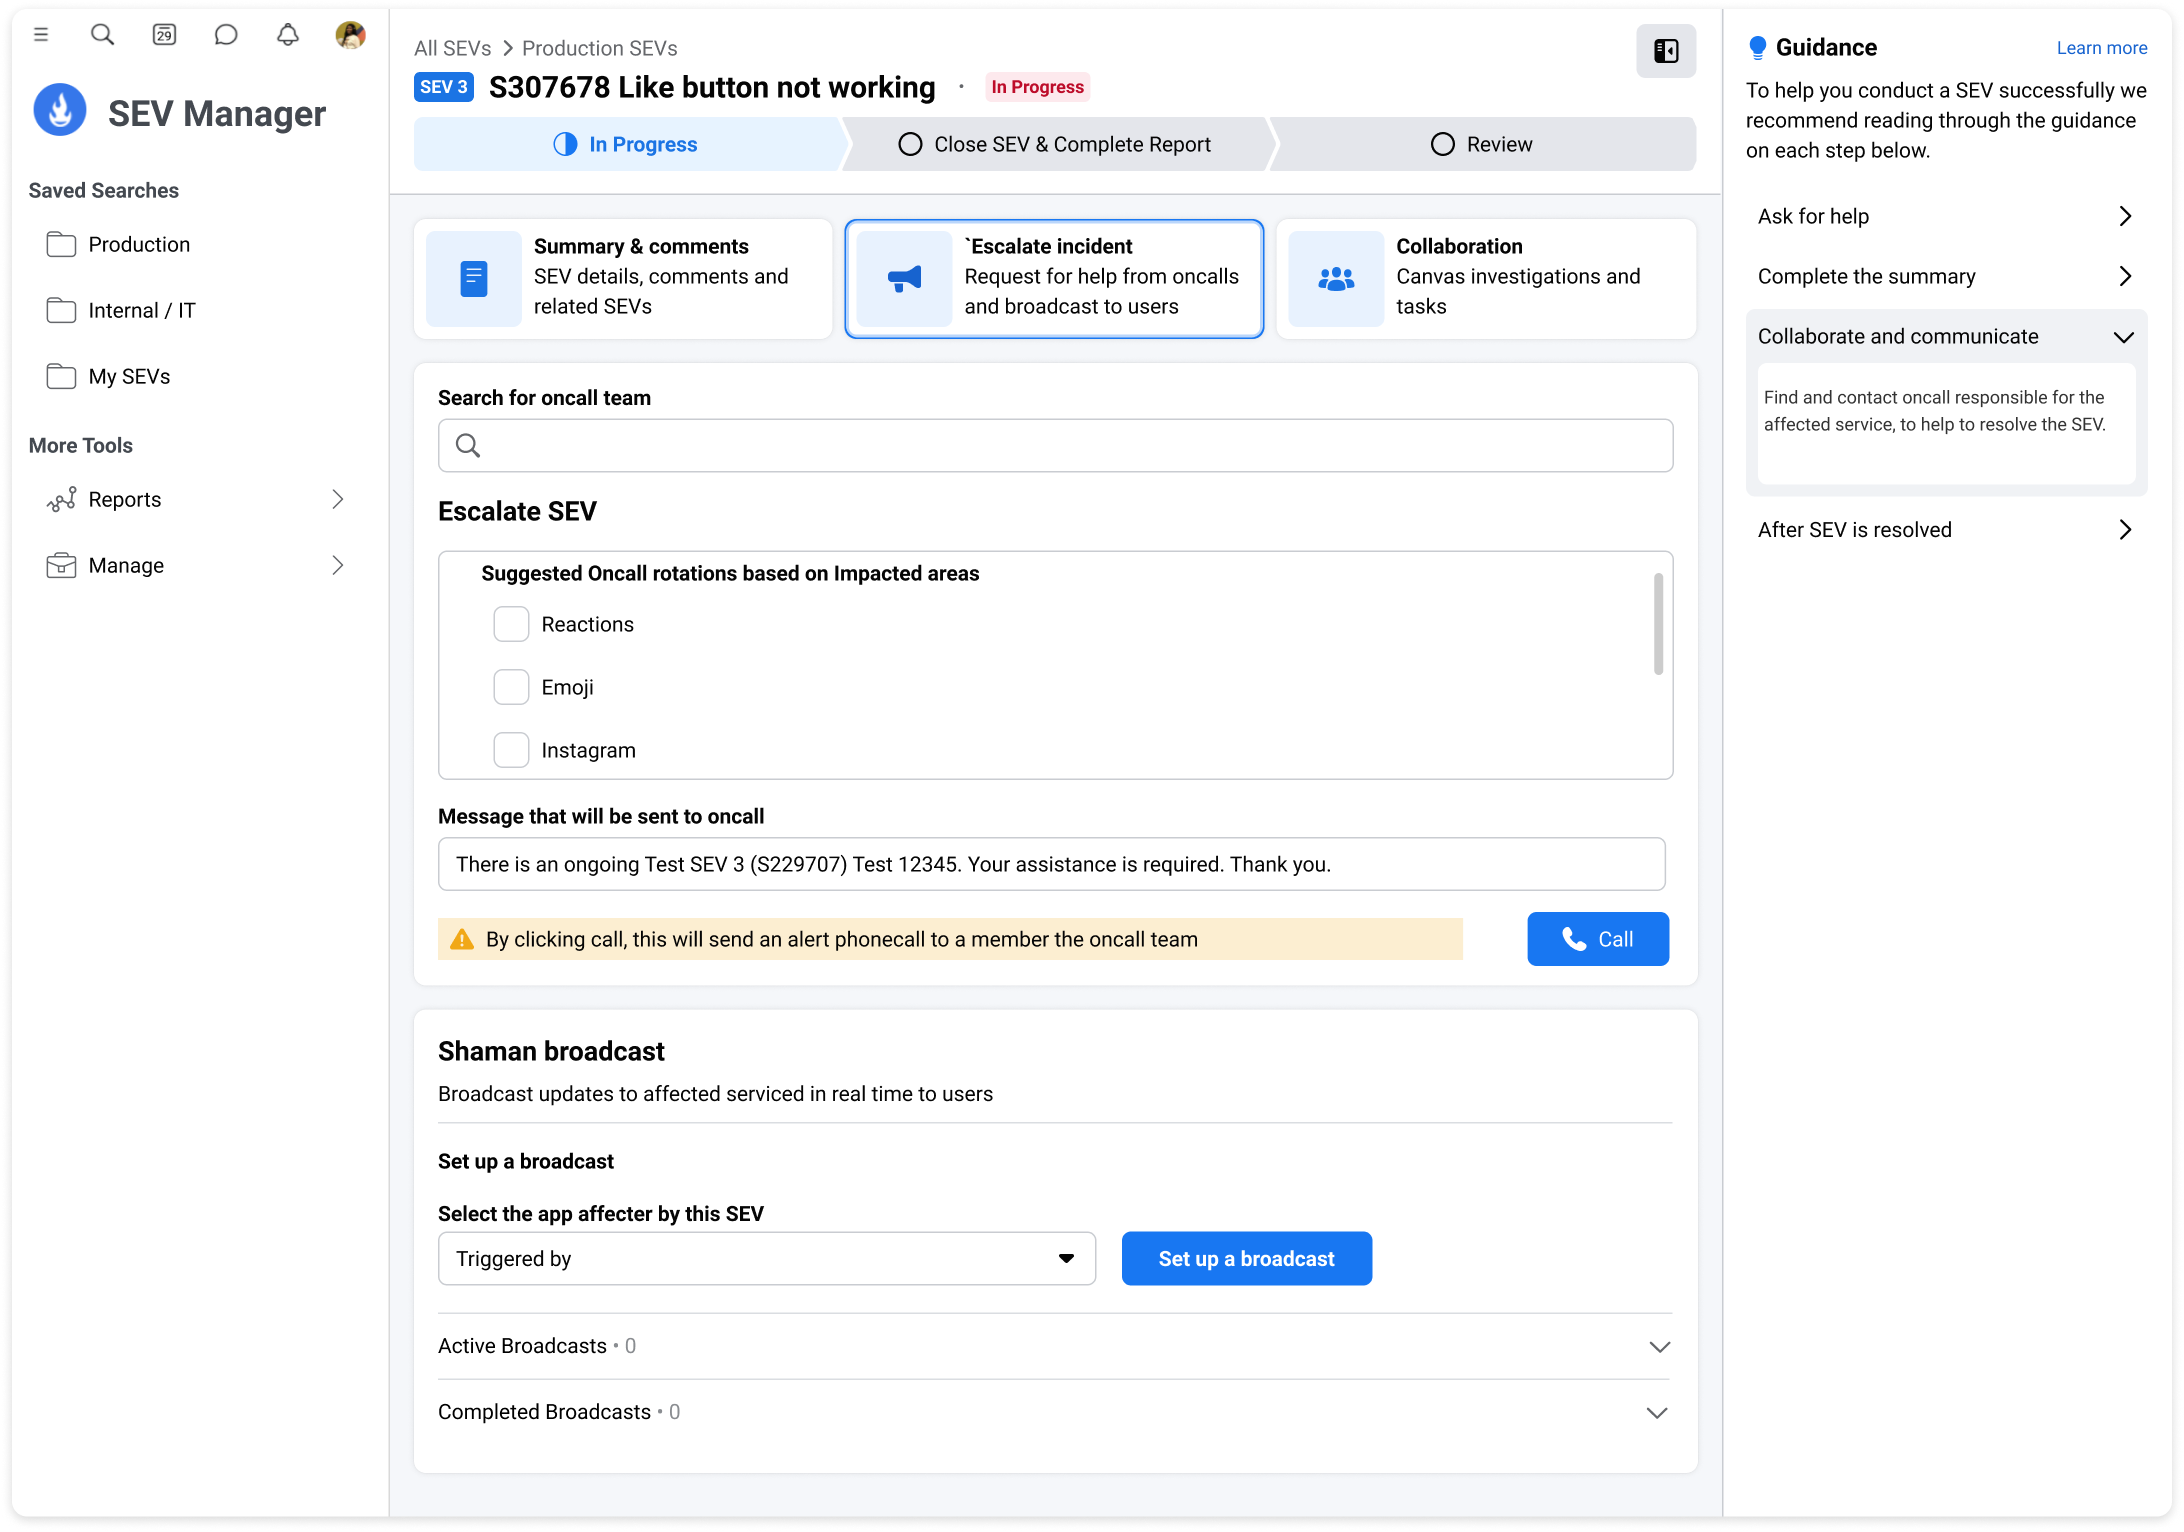
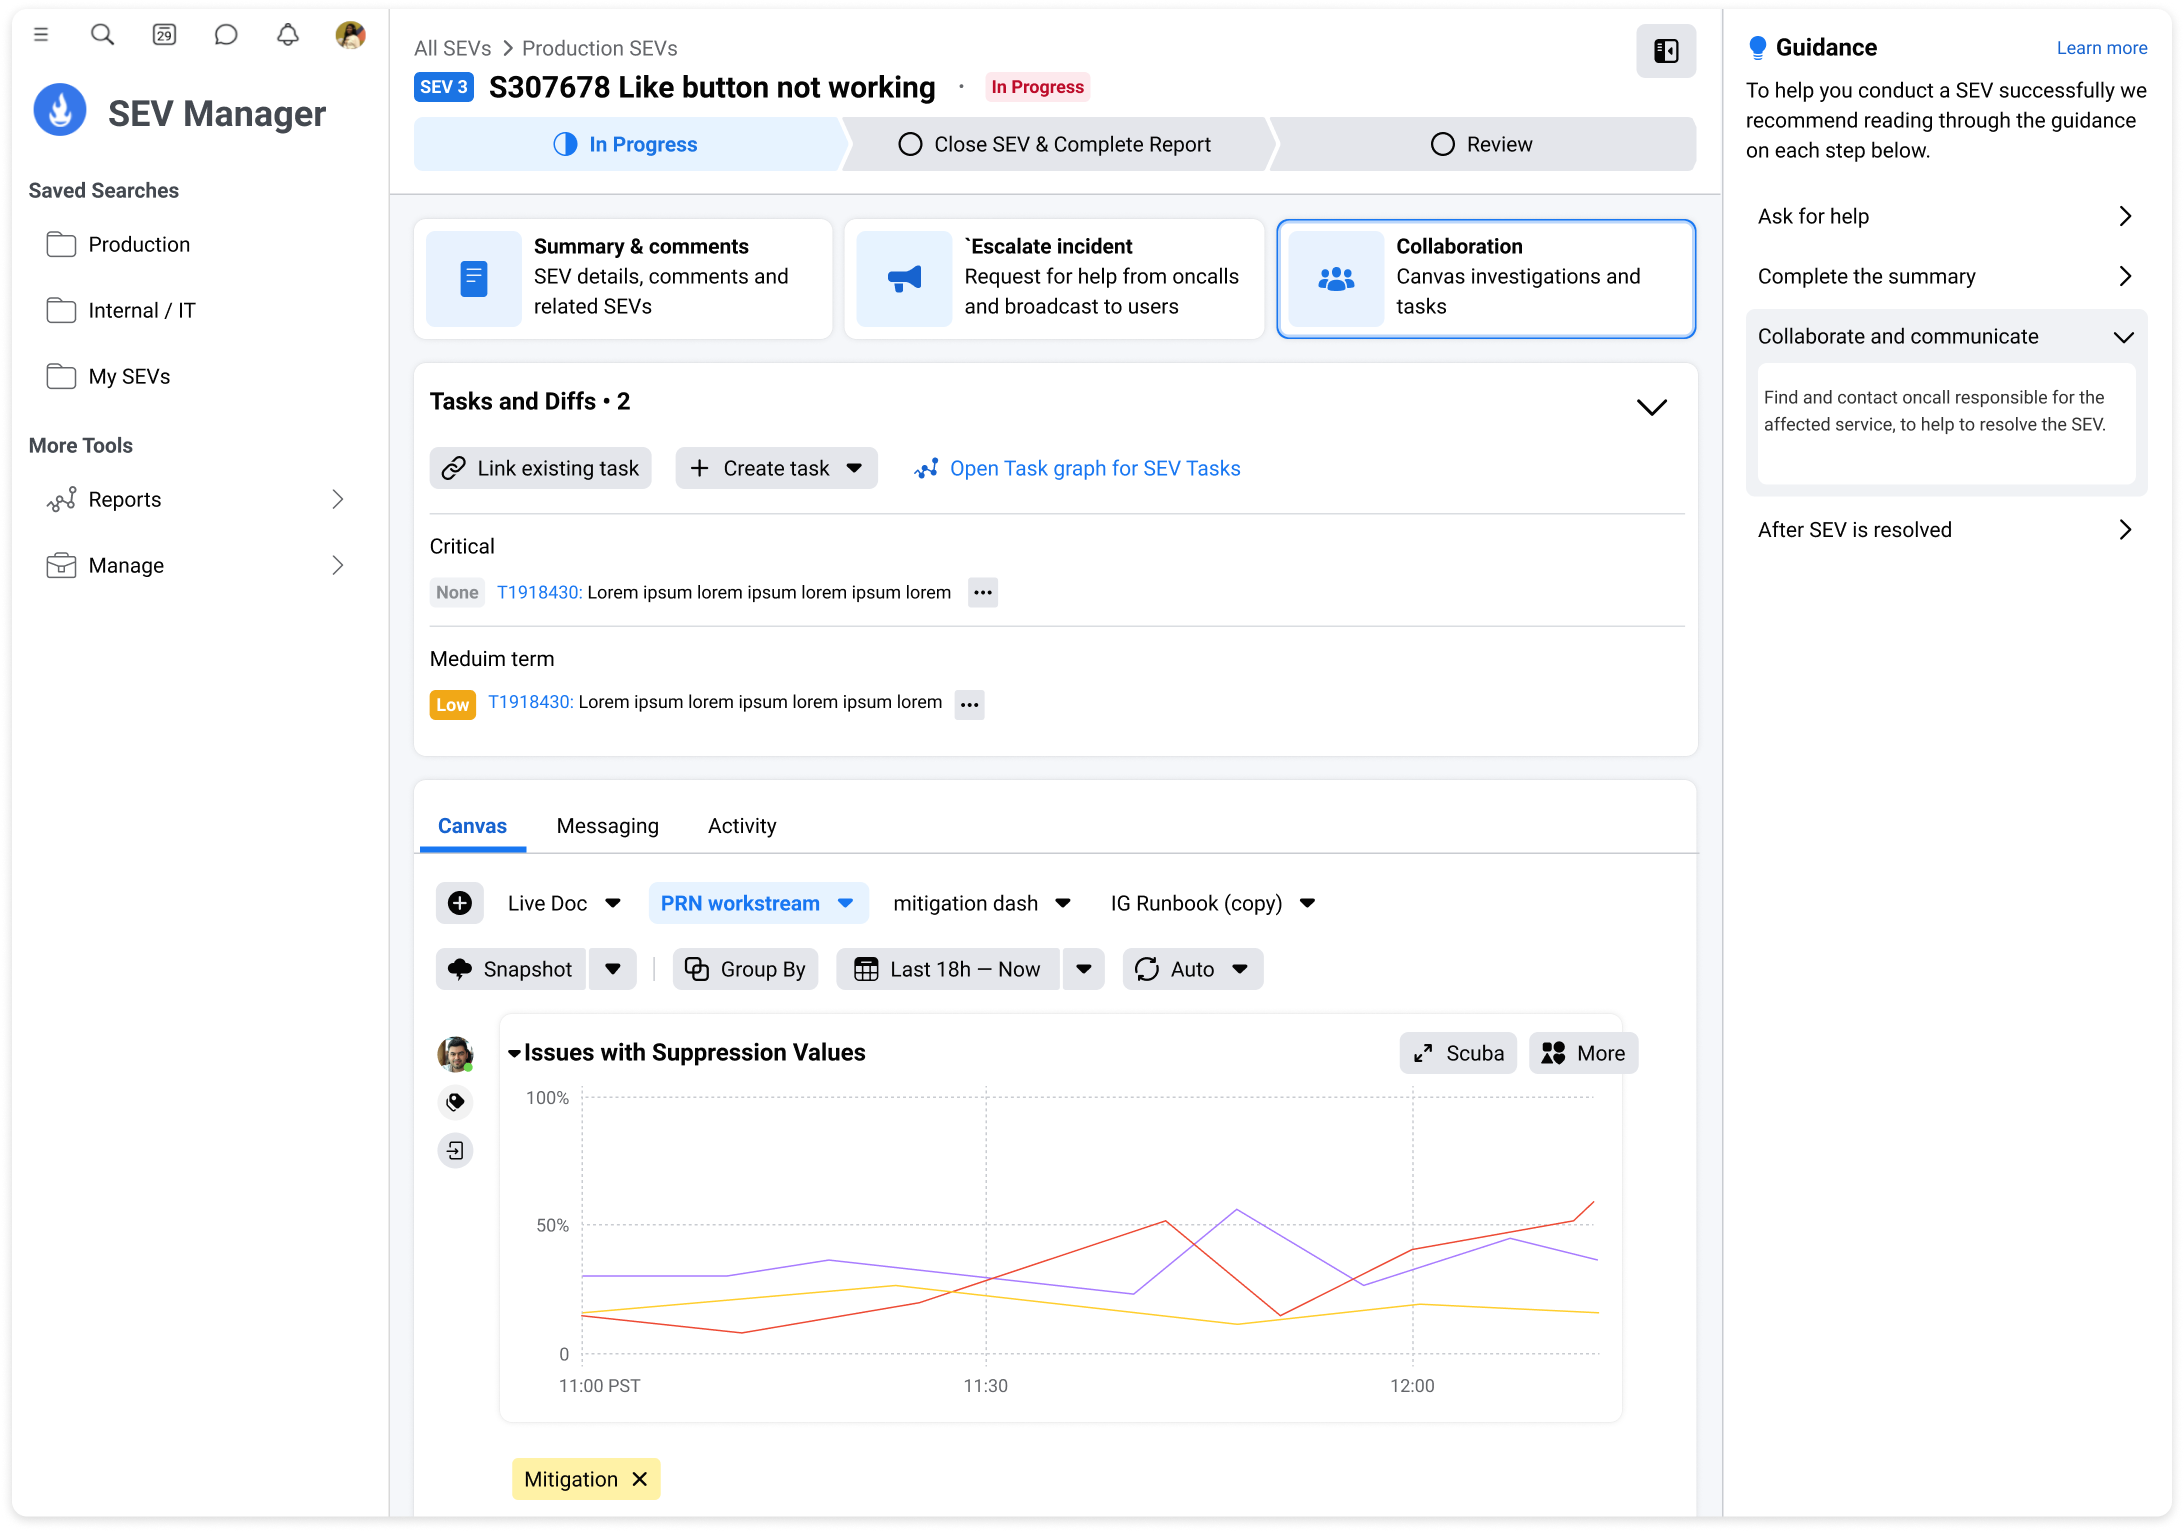
A SEV is a ‘ticket’ that is created when an incident occurs within a product in the company. It serves as a way to document the incident, and to alert others who may be needed to help mitigate or that may be affected by it.
Once a SEV has been mitigated a review takes place to further understand the root cause of the problem, and to prevent recurring incidents buy extracting learnings and creating follow up tasks.
The challenge
There are approximately 2,000 SEVs a month, ranging from minor incidents to, very rarely, entire company outages.
The biggest problem is that there are too many tickets that are not being reviewed and learnings aren’t being extracted to prevent recurrence.
The entire SEV process and tooling was created without a designer, so the tooling was fragmented and not ntuitive.
Users have to jump between multiple tools to plan and conduct reviews: Agenda, Calendar, Configurator, Google docs/ Quip, Tableau
As the company grew this has created inefficiencies in reviewing SEVs, which results not enough SEVs are being reviewed. It was vital that this was addressed as the entire company relied on this tool
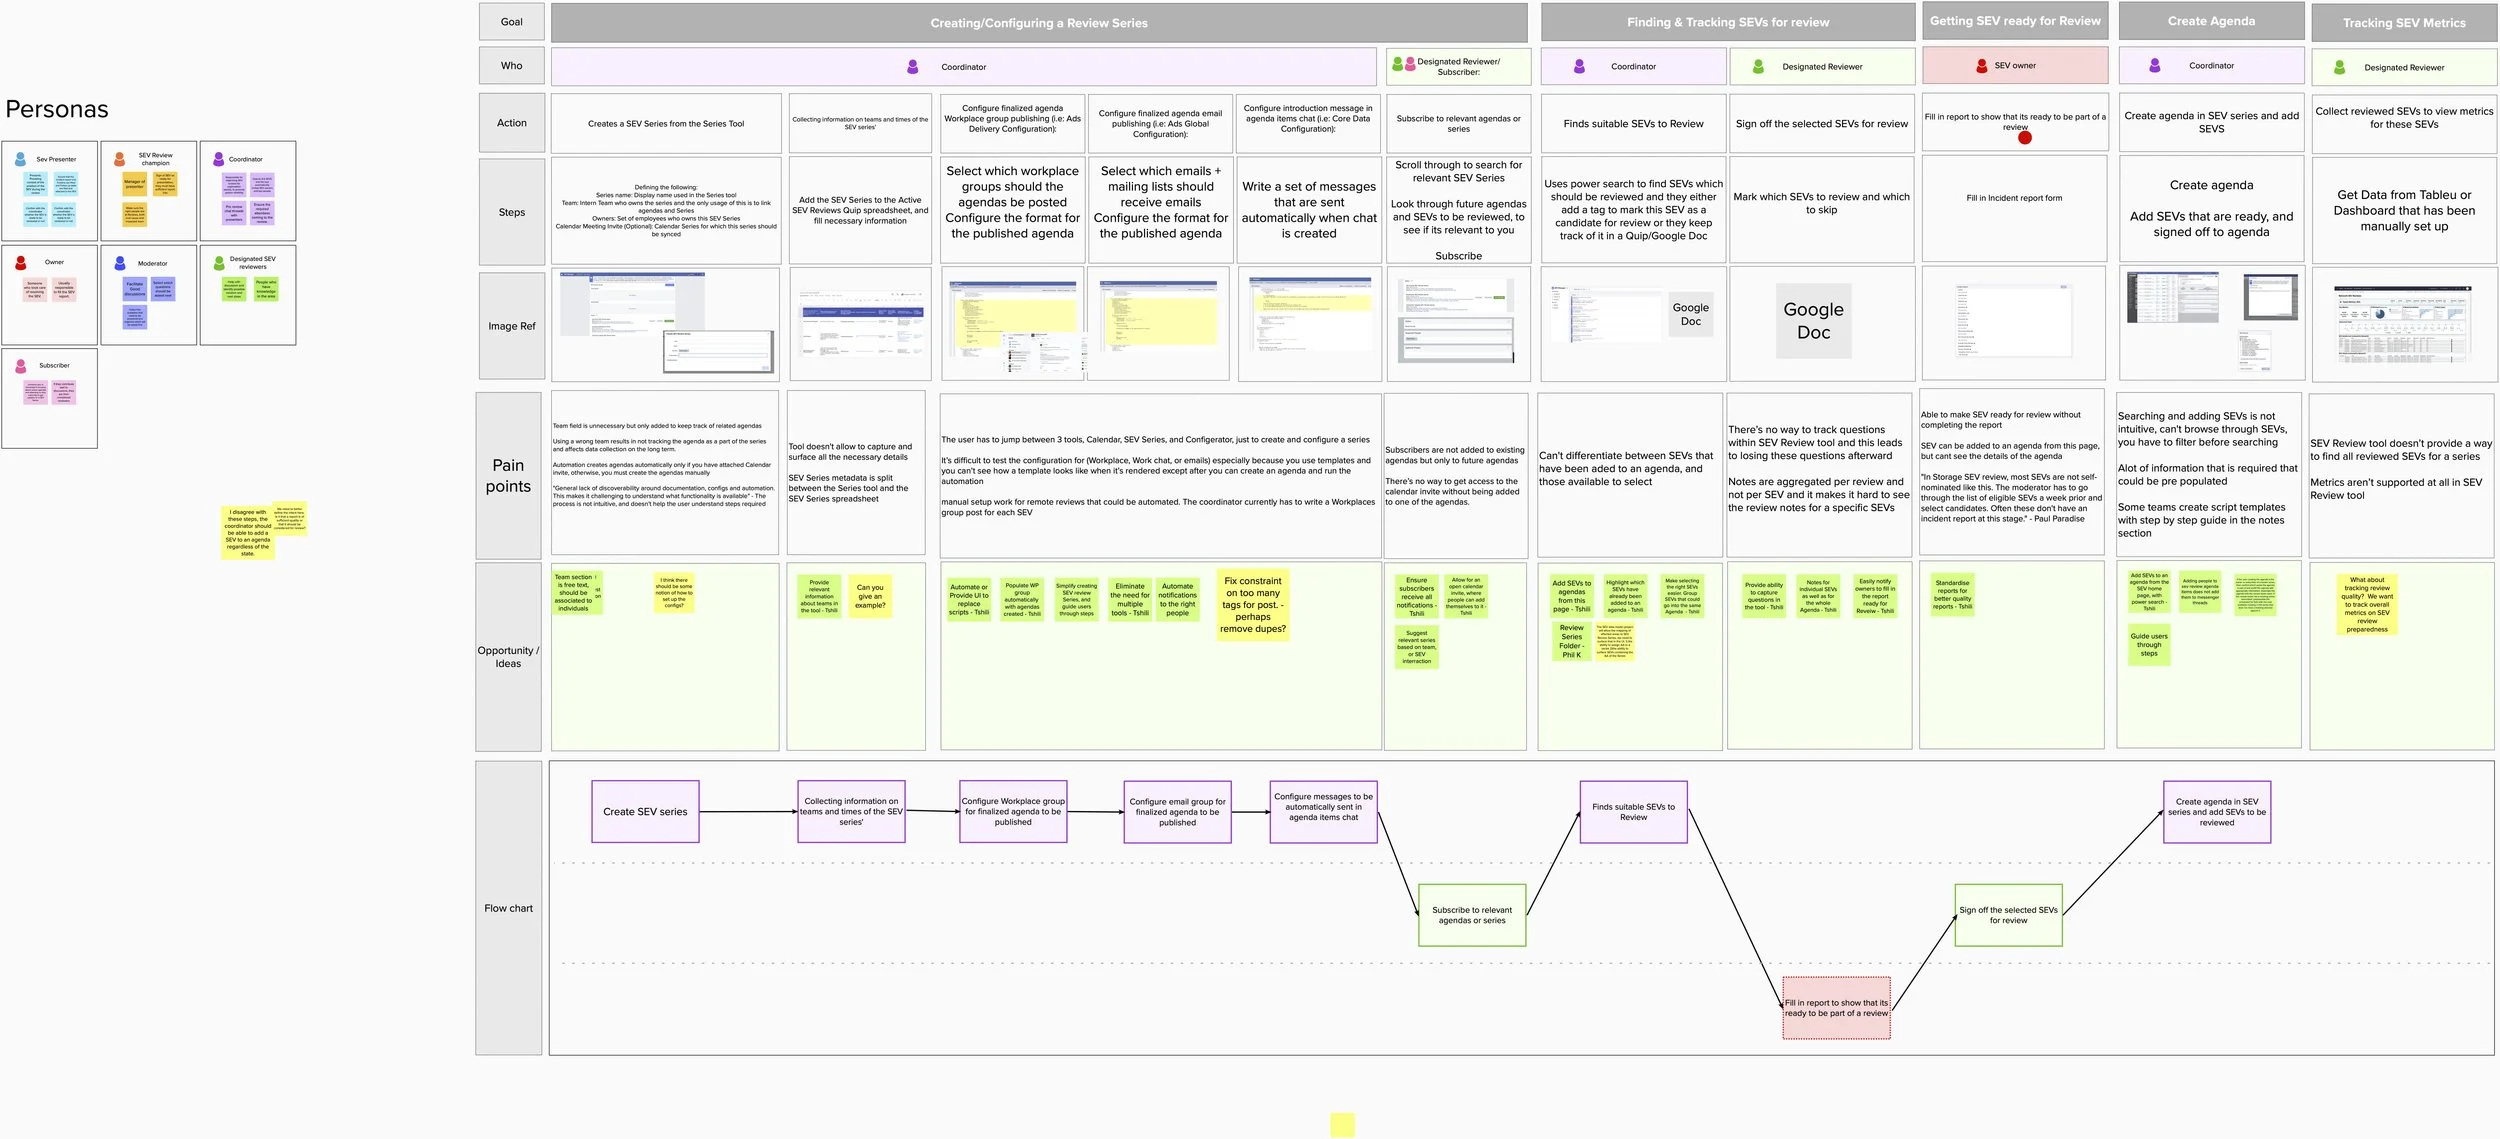
Journey map
I conducted user research to identify all the various personas involved and outlined the entire SEV review process.
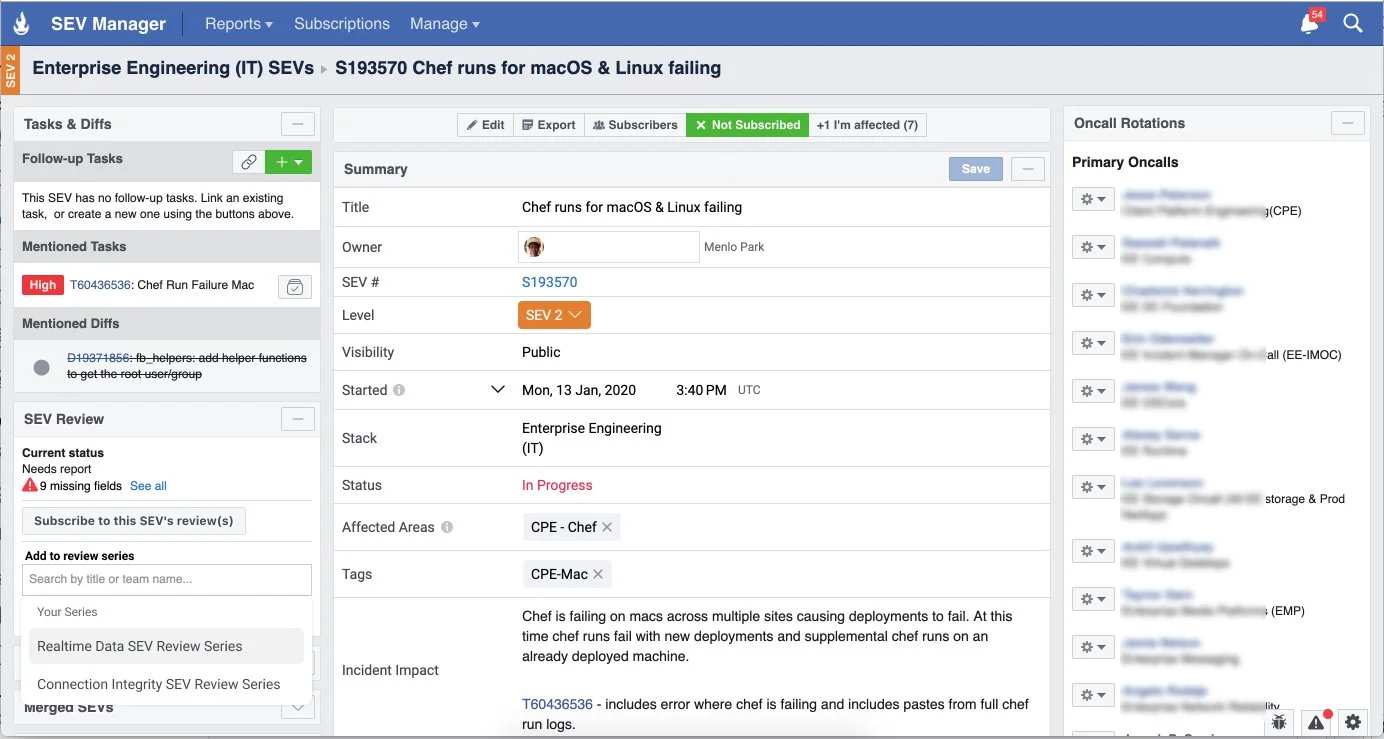
Old design
SEV tool and SEV Review tool

Goal
The high level goal was to help teams review incidences and reduce re-occurance.
The main goal is to create a seamless end to end review tooling, by helping users:
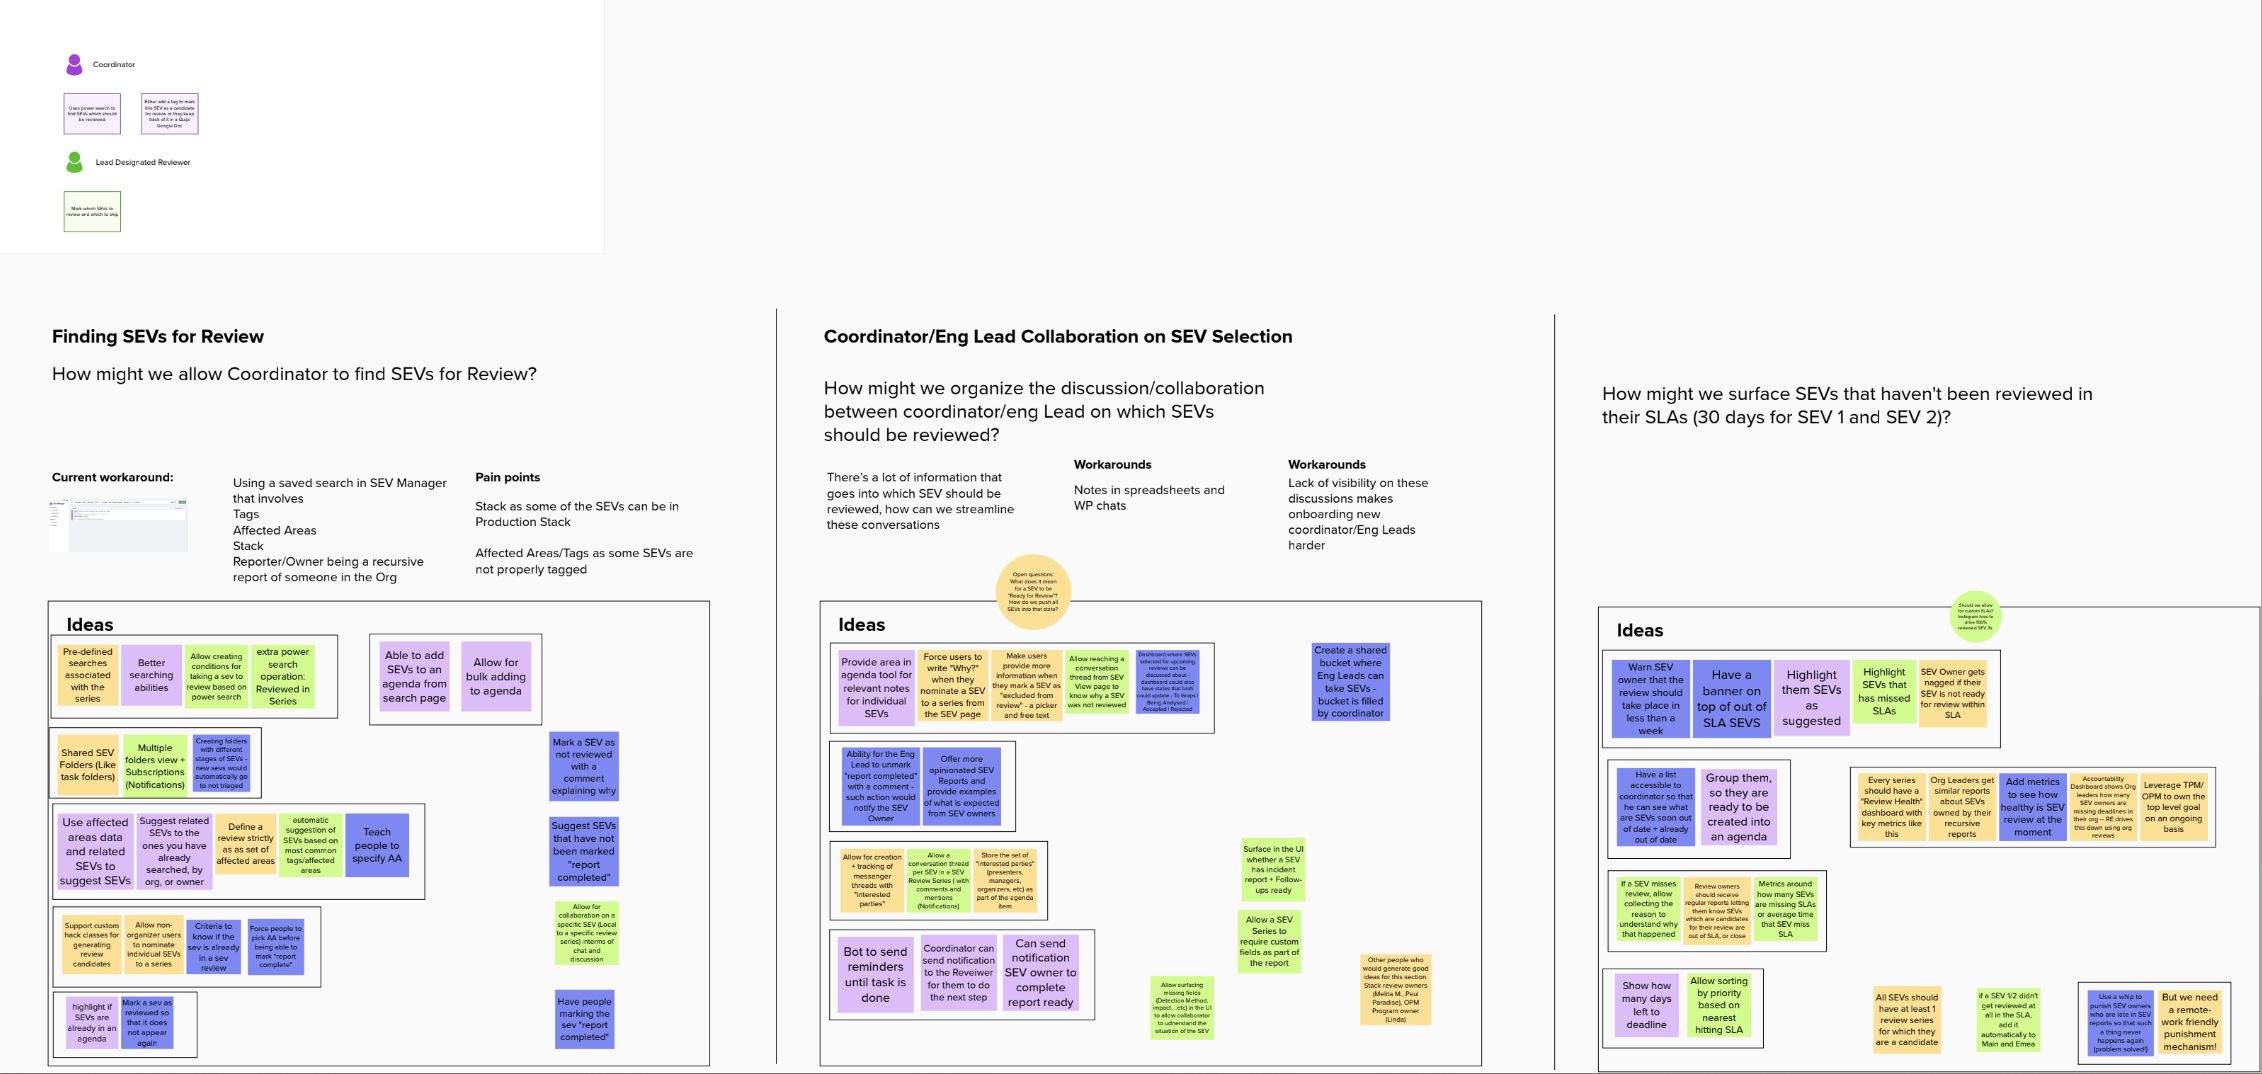
Easily find SEVs to review
Triage SEVs to the right review meeting
Easily schedule regular review meetings
This can be achieved by:
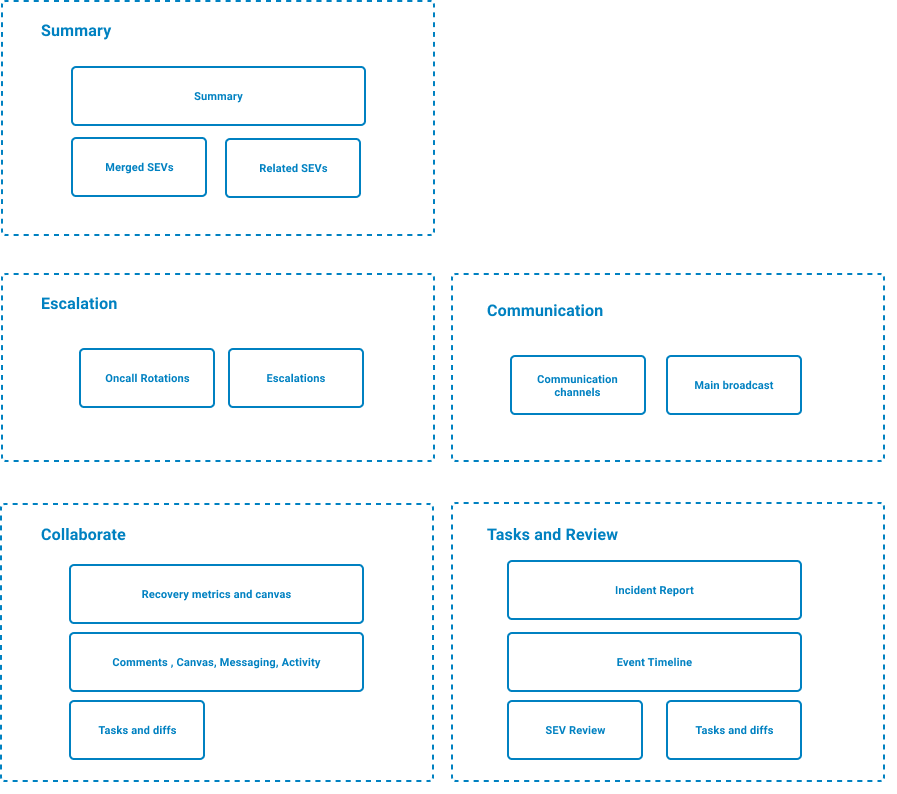
Streamlining the different workflows into one tool, SEV Review Series.
Introduce automations and auto populate data based on Series configuration
Link to other tools for seamless communication; Emails, calendar and team chat
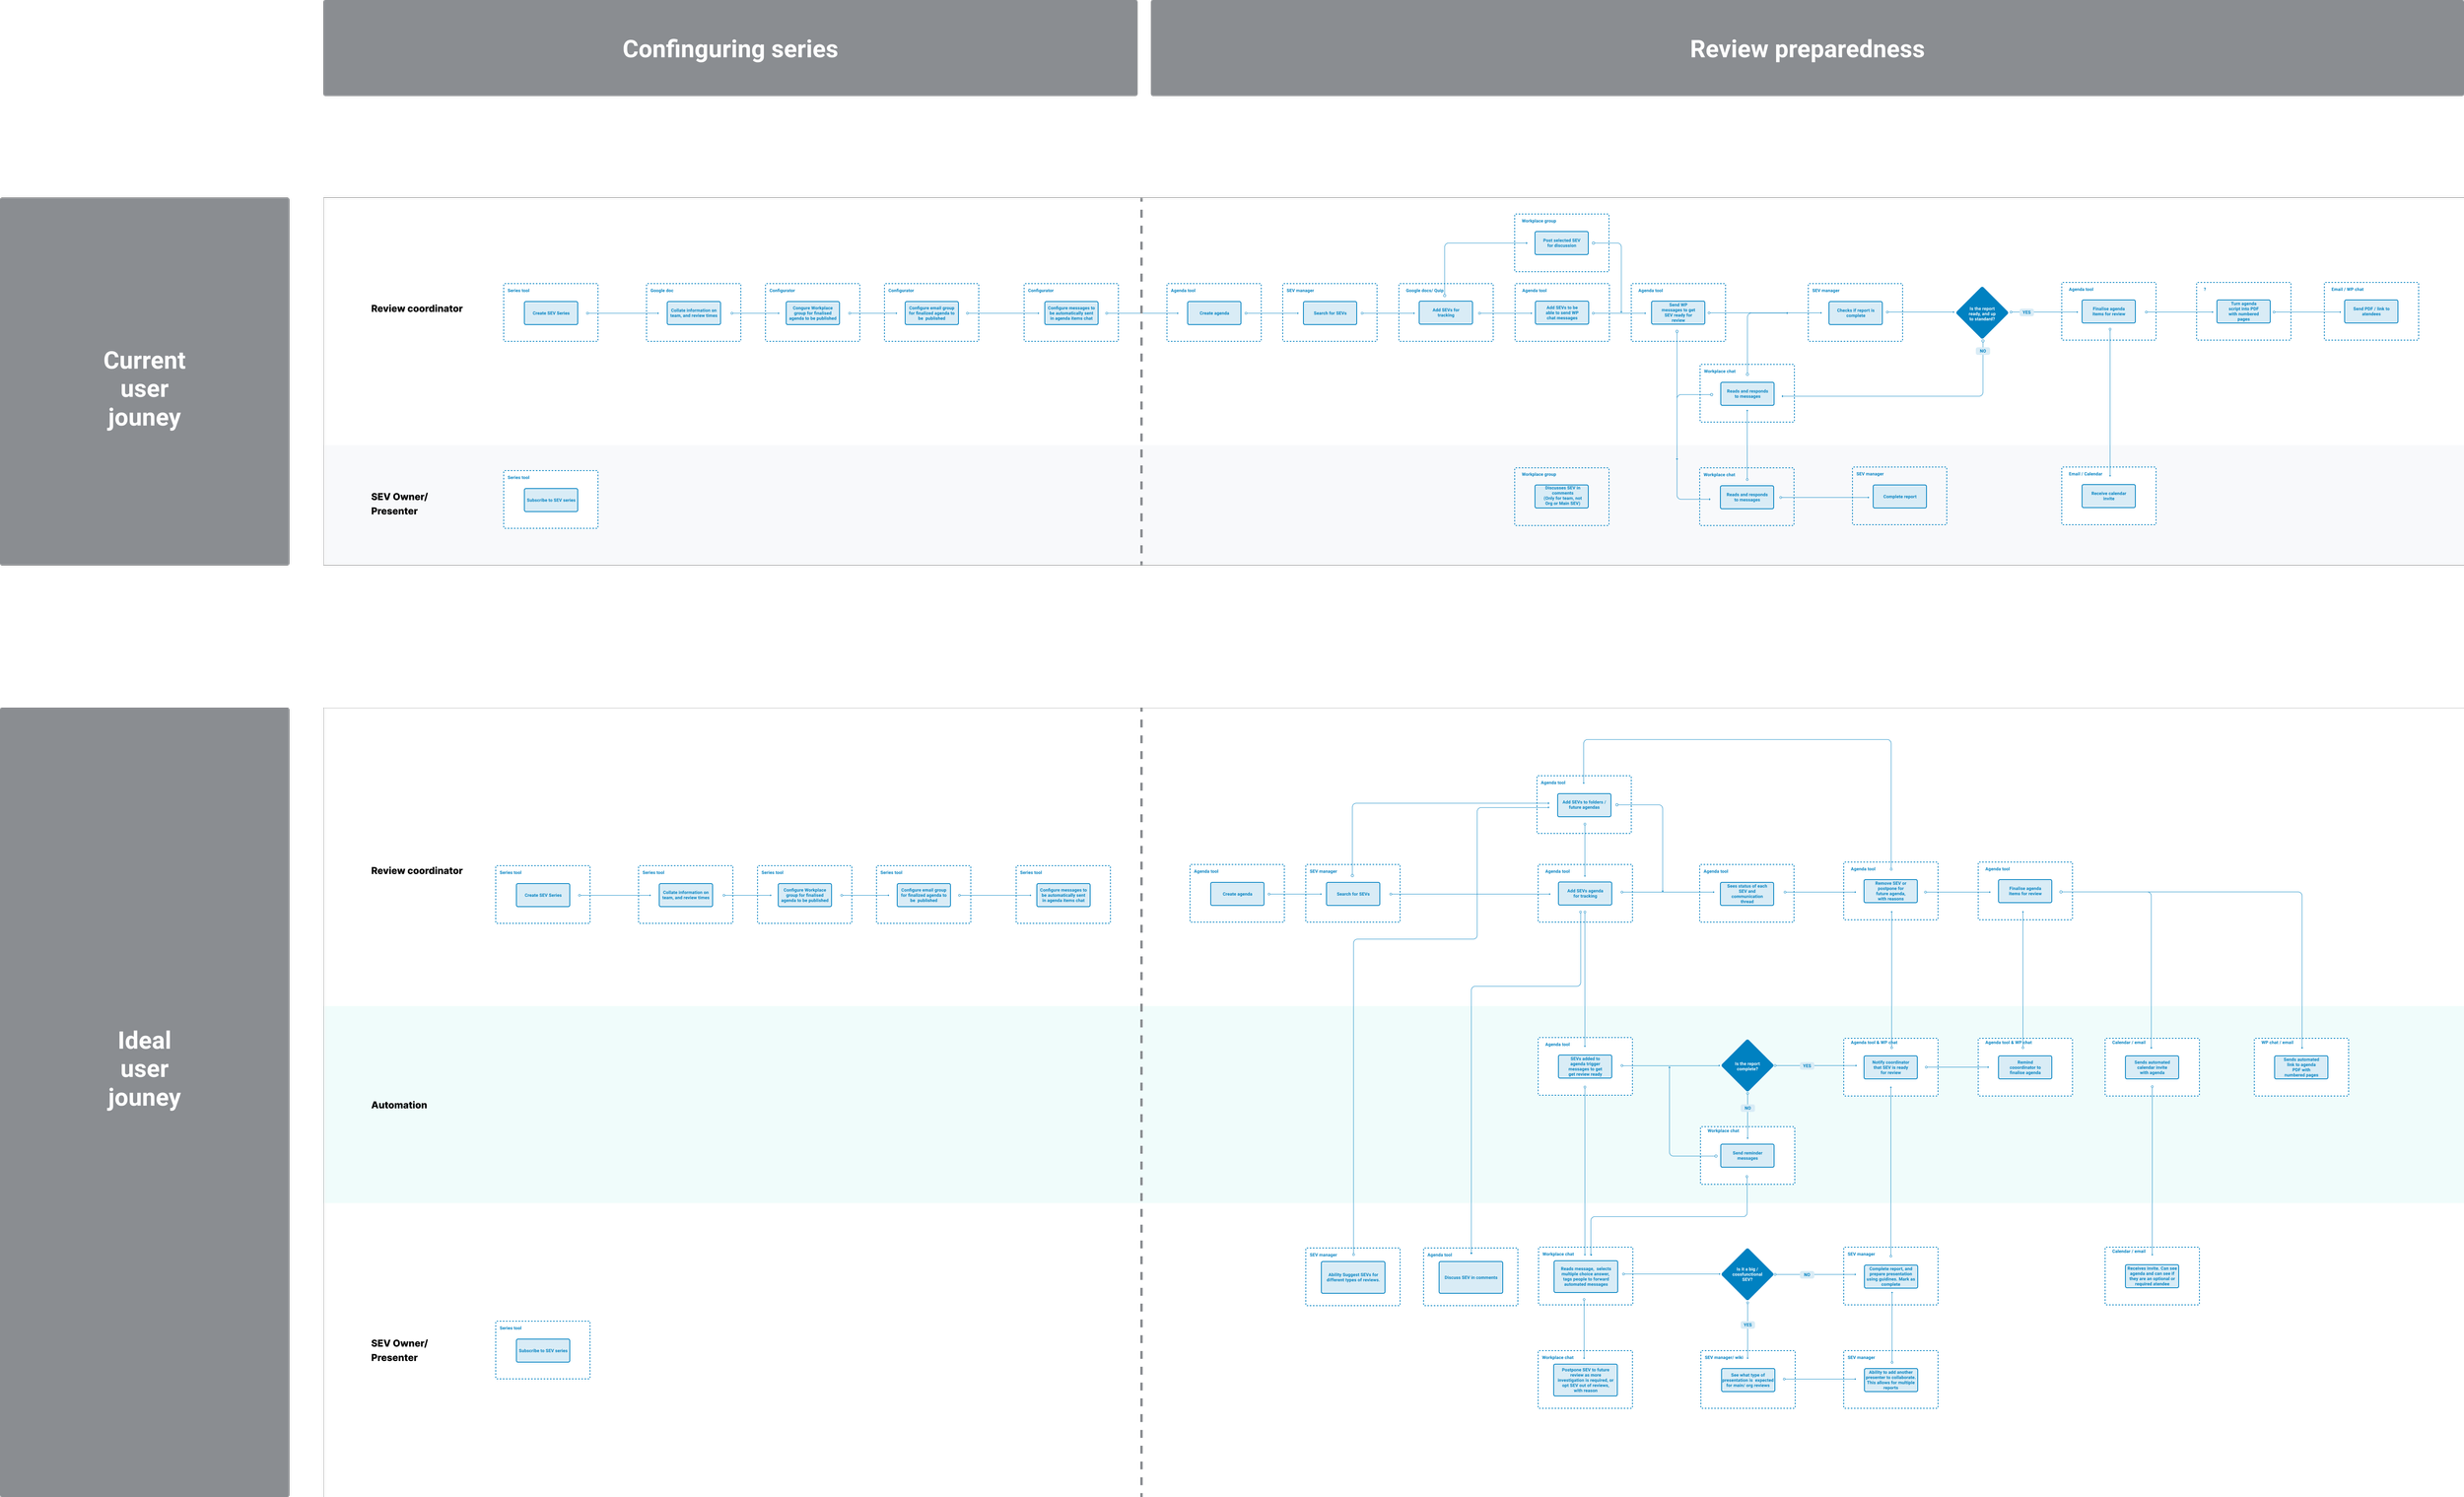
Process map
I mapped out the current high level process and created an ideal journey, including how the process can be improved with automation
Projects
We identified key areas to explore as separate projects to reach each goal.
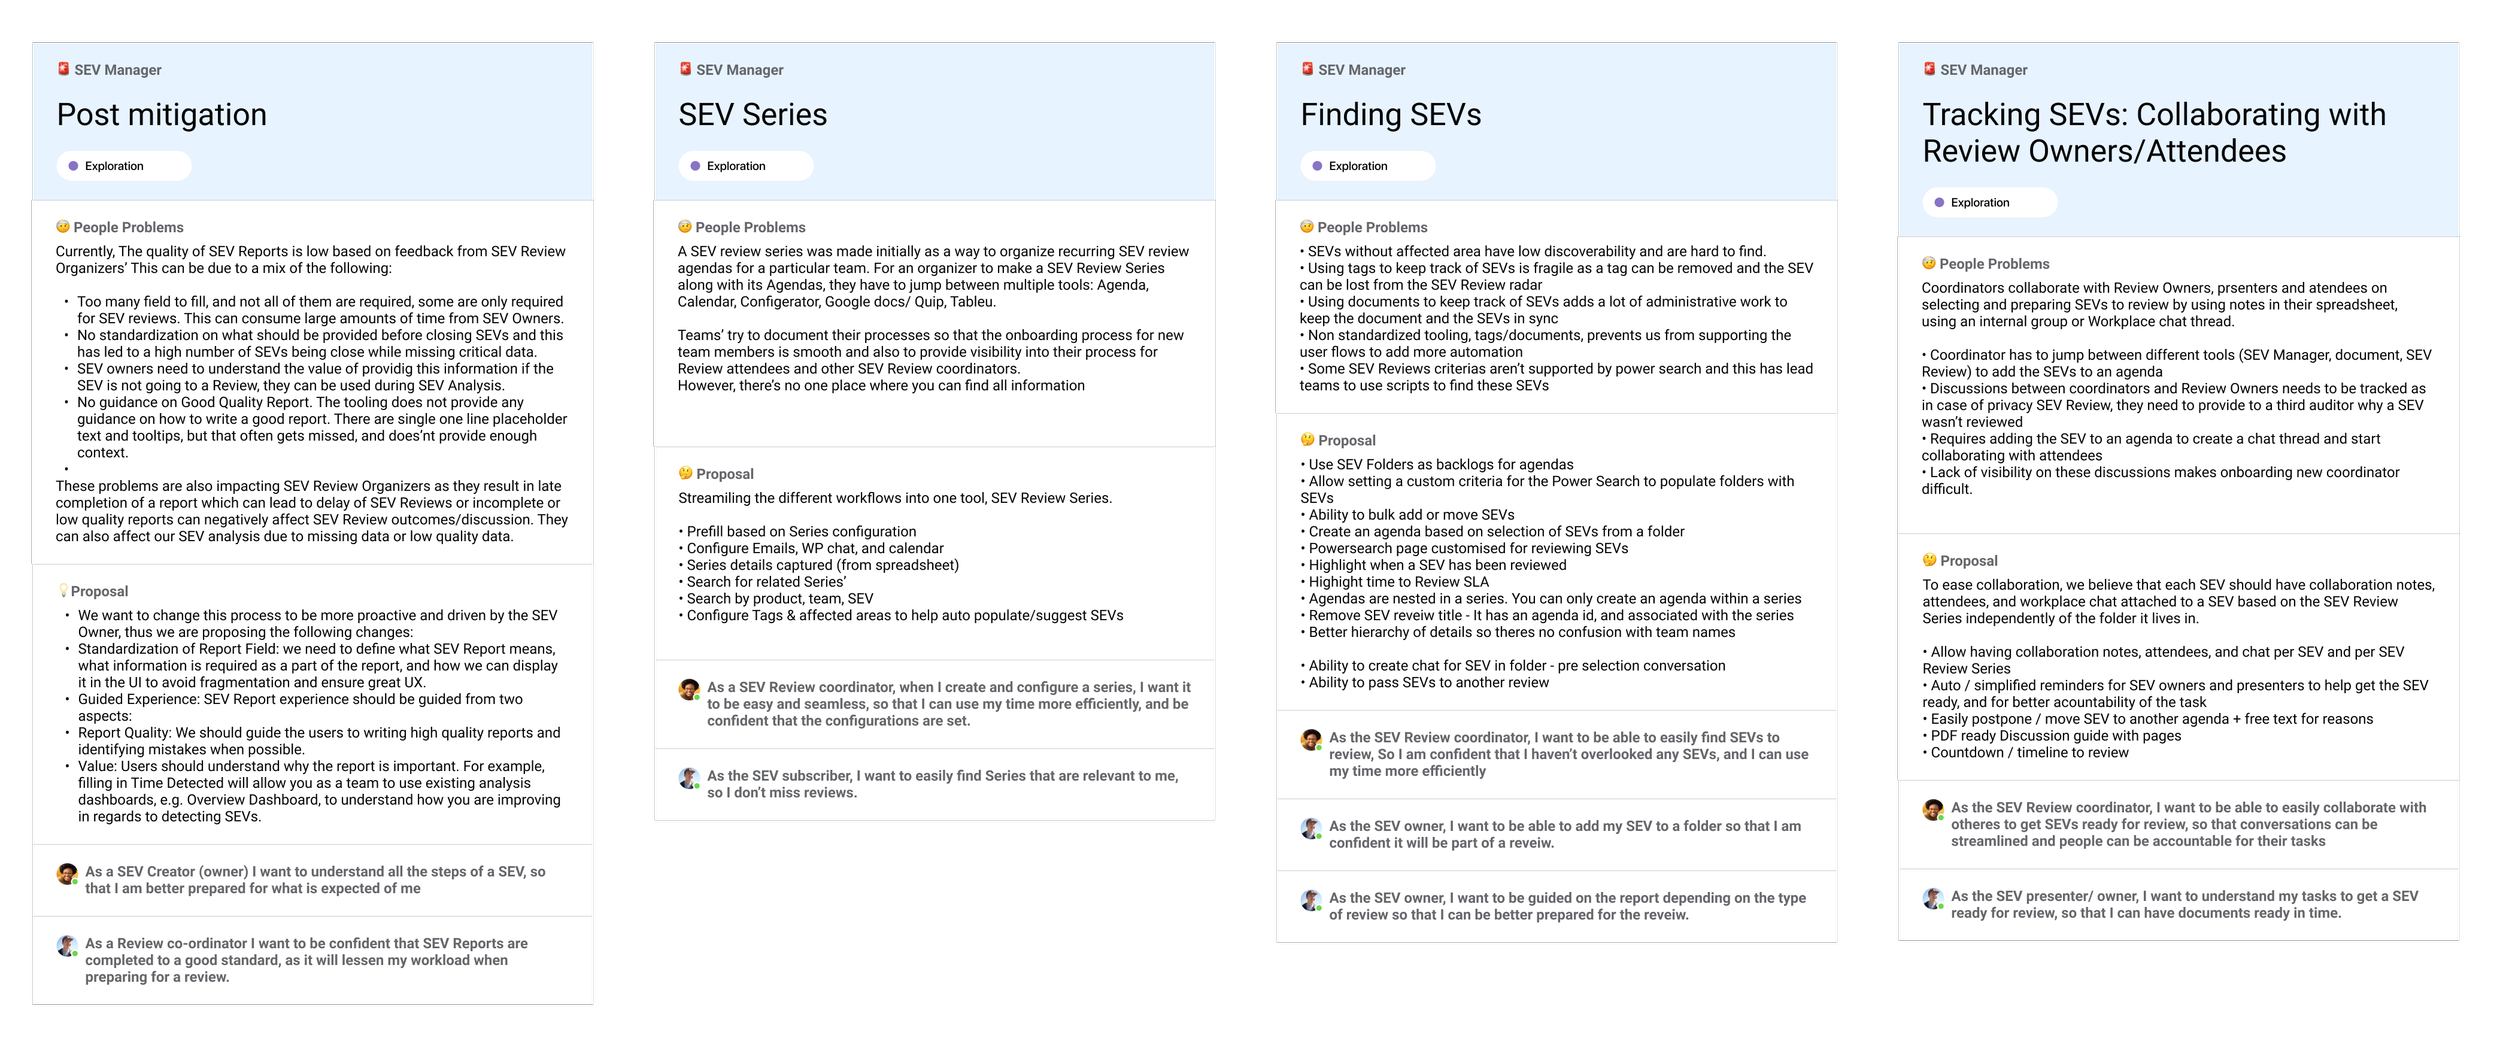
HMW workshop
Using the qualitative research I conducted an ideation workshop with the team, to gather high level ideas with the new process as the goal.
Data Capture
We realised that these projects depended on quality data capture when the SEV was created.
Through data we realised 67% of SEVs were recurring incidents, and most incidents were of high severity, not many small ones. We know that this is caused by a delay in SEV reviews.
Through qualitative research we discovered people weren’t opening tickets for minor incidents, before the incident had grown, as they were worried about false tickets, adding to the backlog of tickets needing to be reviewed
But when incidents are not filed early enough, engineers aren’t able to stop them from becoming large incidents, which in turn creates even more work for the team.
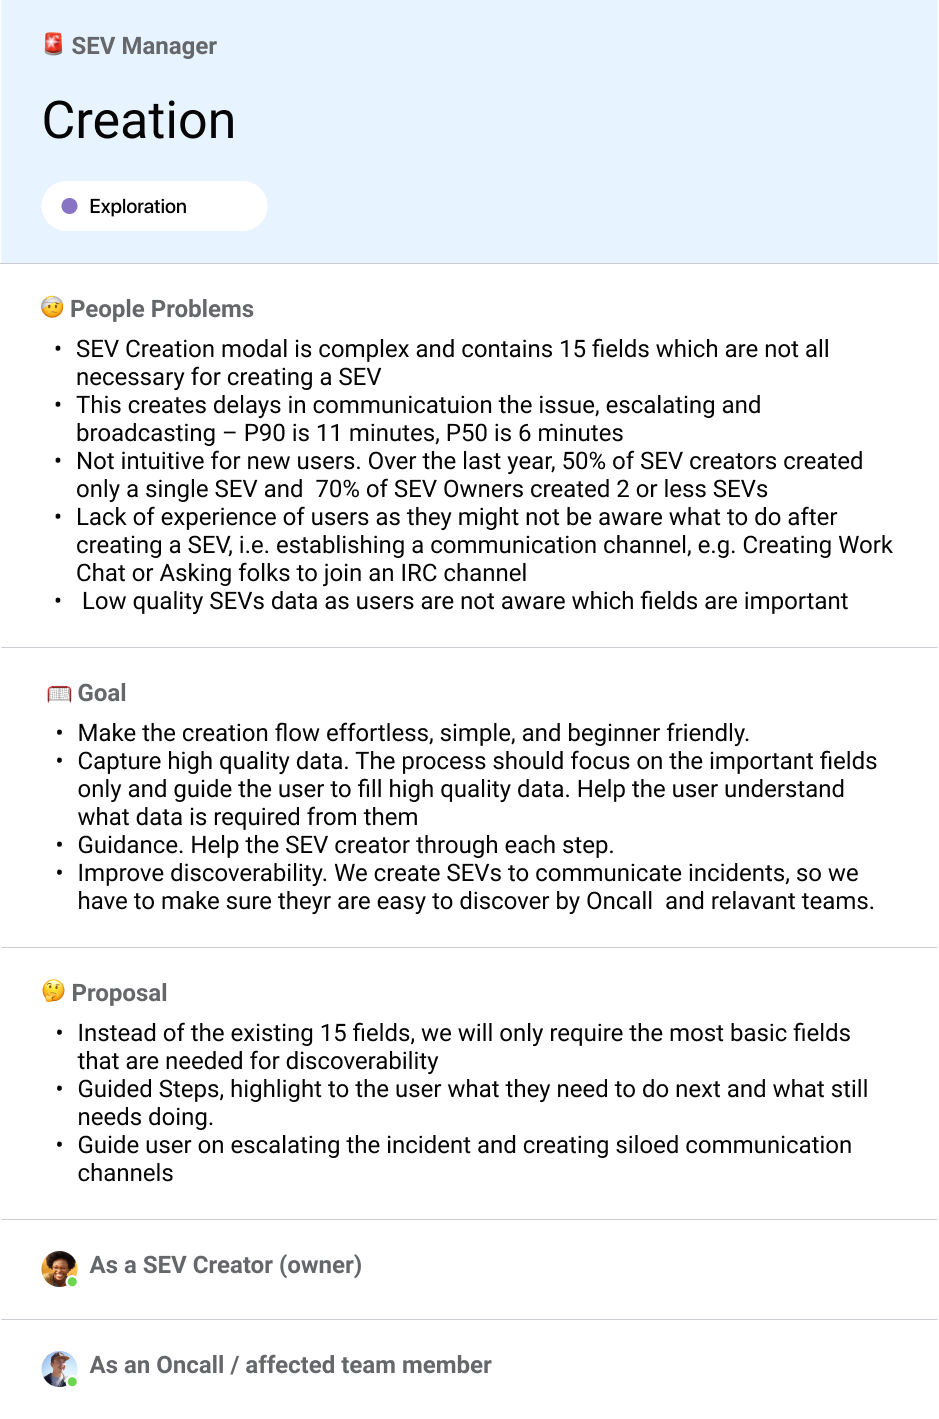
SEV Creation Form
The SEV Creation form is complex and contains 15 fields which are not all necessary for creating a SEV.
Measuring success
Measuring success for this project was not as straightforward as seeing a reduced number of SEVs.
Through qualitative research, and understanding work pressures we uncovered that, this could indicate that users may be worried about additional admin work to the backlog of tickets.
As the higher level goal is the health of the company’s systems, we had to be careful to not focus on a reduced number of SEVs as a goal.
How might we
Encourage engineers to open more low SEVs, without the worry of additional admin work
Make the SEV creation process quicker, only capturing relevant data
Ensure high quality data capture
Grouping information
In order to reduce the number of form fields to only required fields that are needed at creation, I had to make an assessment of all the fields, group them and prioritise them.
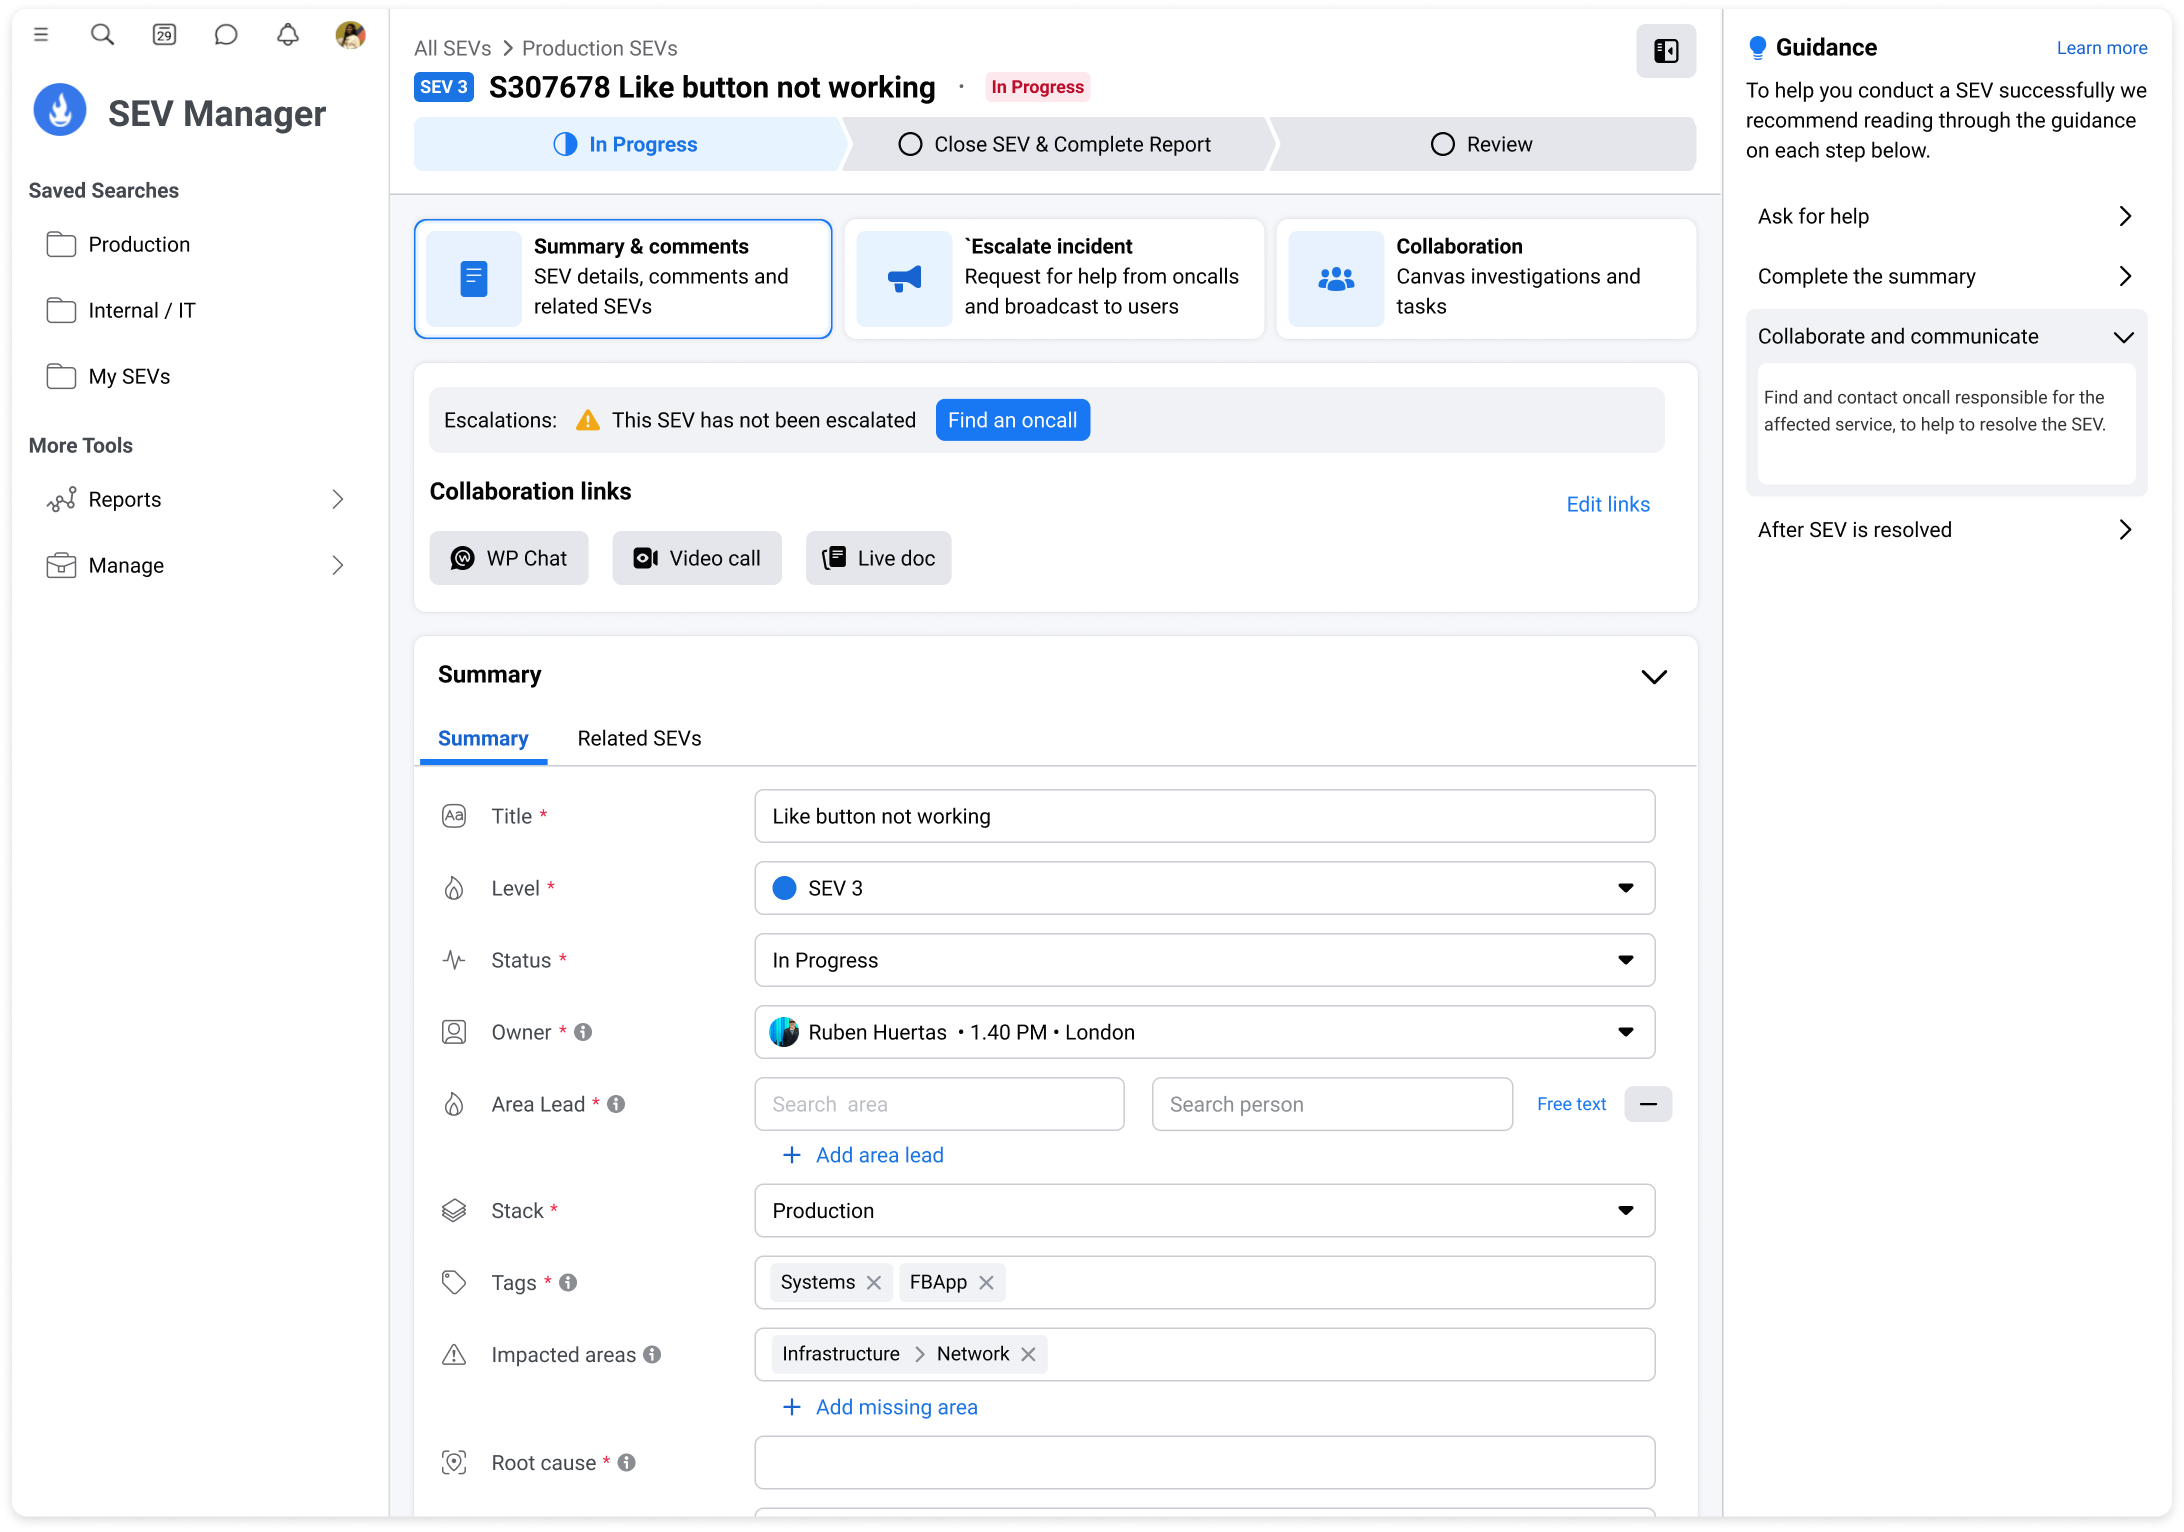
Design concept
The main goal was to create a focused short form with essential information only. So this was an overlay window with a 3 step guided process.

Launch and results
After multiple rounds of user testing and feedback we launched the new SEV creation flow to 3 controlled teams over a period of 2 weeks. This allowed us to test using real incidents and gave us confidence to launch to the wider company.
Results
We successfully decreased the average time to report an incident from 8 minutes to 3 minutes.
After 2 months we noticed that there were 17% less SEV 3’s. We used this as a measure of success because this was the most common type of SEVs, and they had one root cause.
There were more pre-emptive and low SEVS being created, which meant problems were being caught early.
This also resulted in less SEVs needing to be reviewed, which aligned to our original goal.


SEV Tool Re-design
Please be aware this page is not linked on the main home page