Shell Energy Assistant
Tasks
UX, UI, Research, Design system, Product launch
Time
Nov 2021 – March 2023
Energy Assistant is a digital service exclusively for the German market, that assists consumers to understand potentials for cleaner & more efficient energy usage. Energy Assistant is part of Shell’s decarbonisation initiatives towards they Net Zero goal.
Energy Assistant is an app that works with a meter reading hardware that plugs into the user’s electricity meter to surface consumption data. Using machine learning and algorithms the hardware is able to detect which household appliance is in use. This makes the data we surface actionable for the user to reduce consumption.
As part of Shell’s target to Net Zero, they need to get users to consume energy in a more efficient way. At a time when energy prices are very high and rising, customers also have a great desire to reduce both bill costs and their environmental impact, and they want guidance on how to to do this. Currently consumers don’t have the data about how they use their energy at home, they need education and actionable insights on how to optimise their usage.
They find it hard to understand what actions make a difference without data, and visibility on household electrical items.
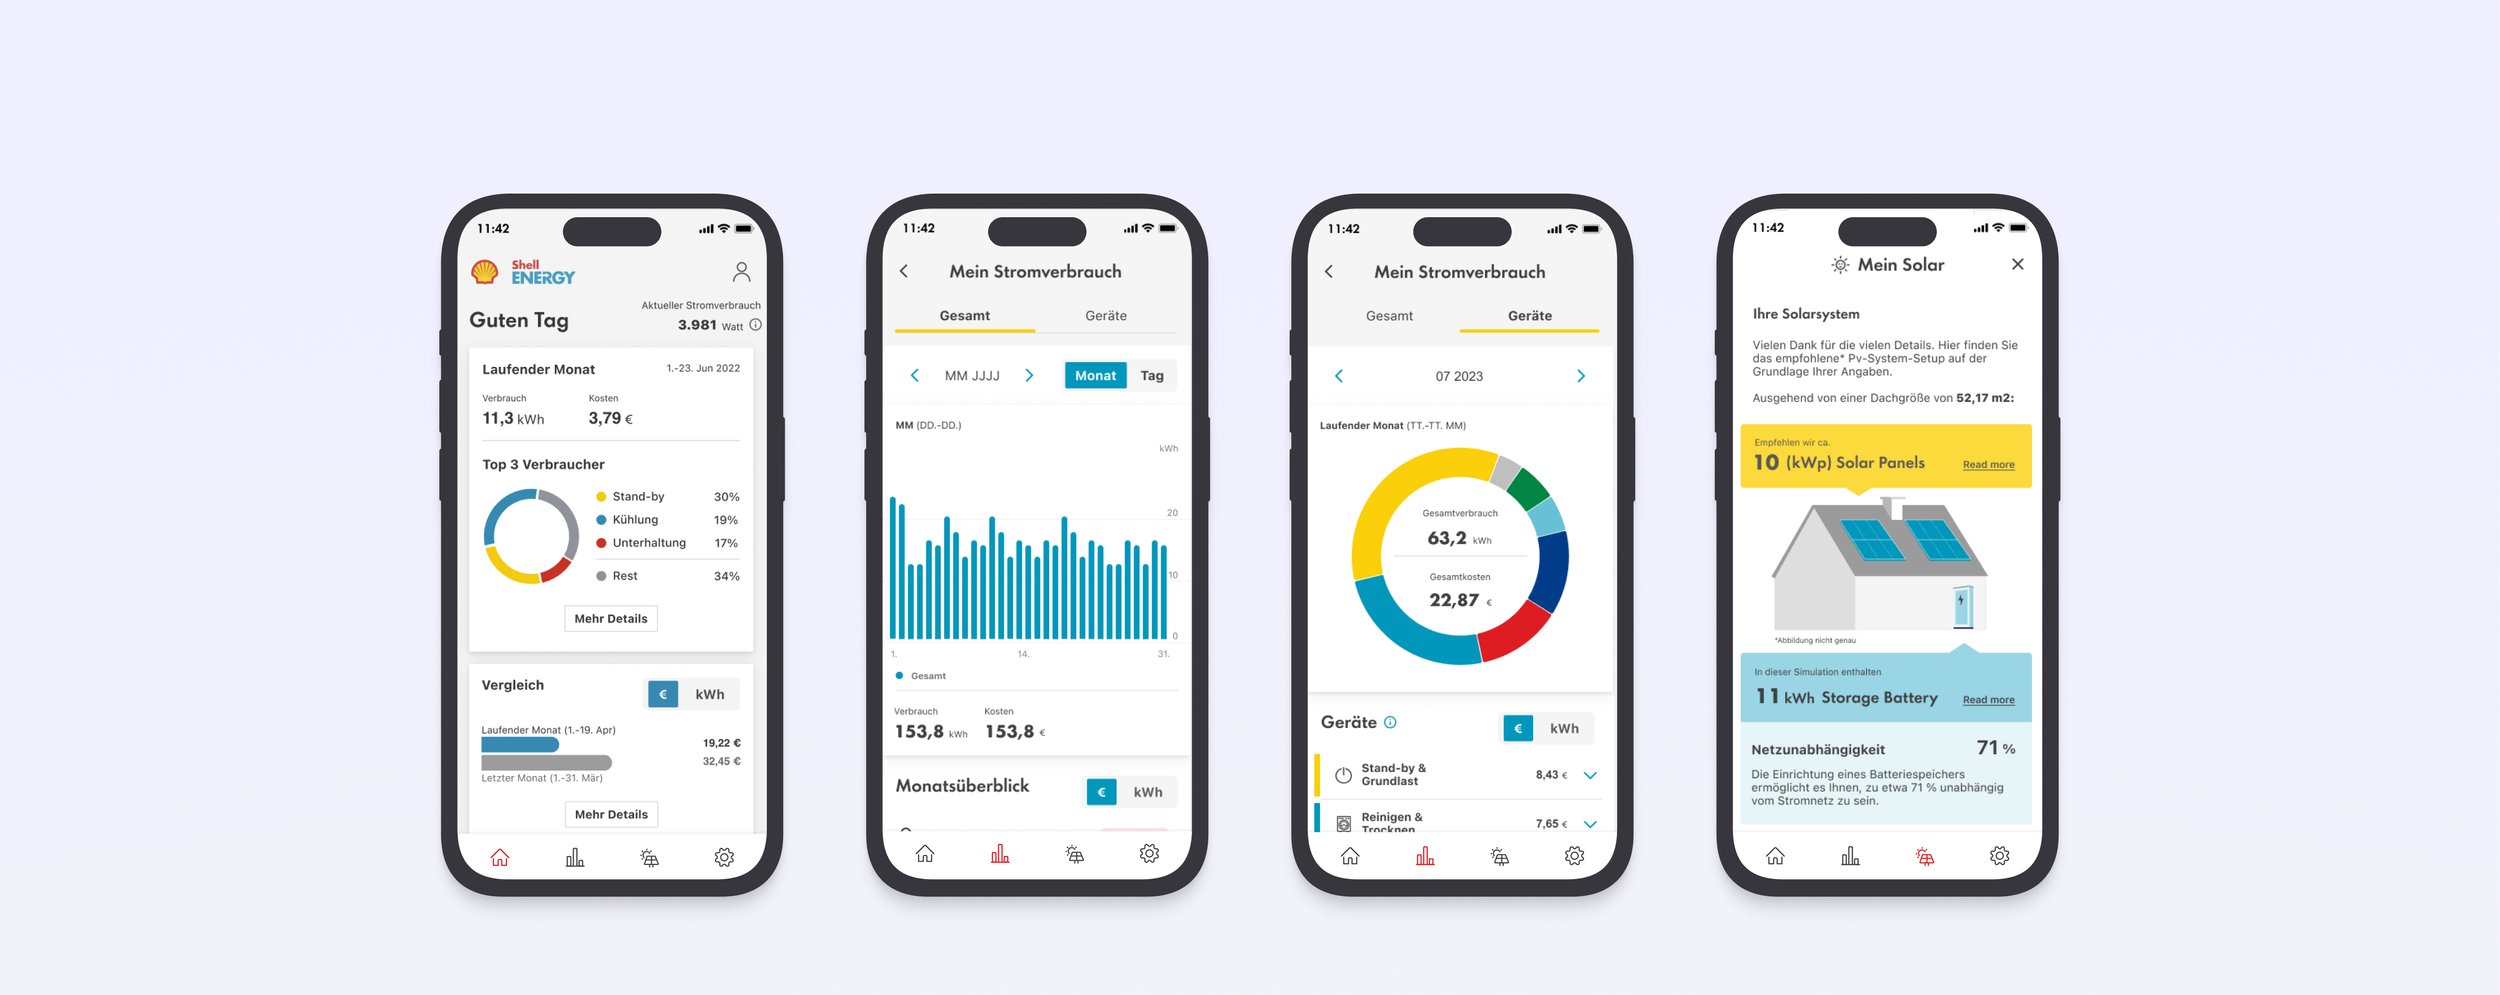
Customers are also interested in technologies that can help them reach their goals, however new technologies such as Solar Panels can be daunting, especially with such large upfront costs
Challenge
Business opportunity
Provide simplified data insights on household energy consumption daily, including granular data down to each household product.
Set and track achievable efficiency goals. Customers consuming less energy is vital for Shell’s Net Zero goal.
Challenges & rewards for energy efficiency improvements & sustainable behaviour.
Virtual solar experience, a digital ‘try before you buy’ feature that uses data to simulate and show users how beneficial Solar panels could be for them. This can also result in making Solar panel sales
User problem statement:
I want to use cleaner and more efficient energy for my home
...but I am overwhelmed with where to start
...and I am afraid to make big investments that I will regret later-on
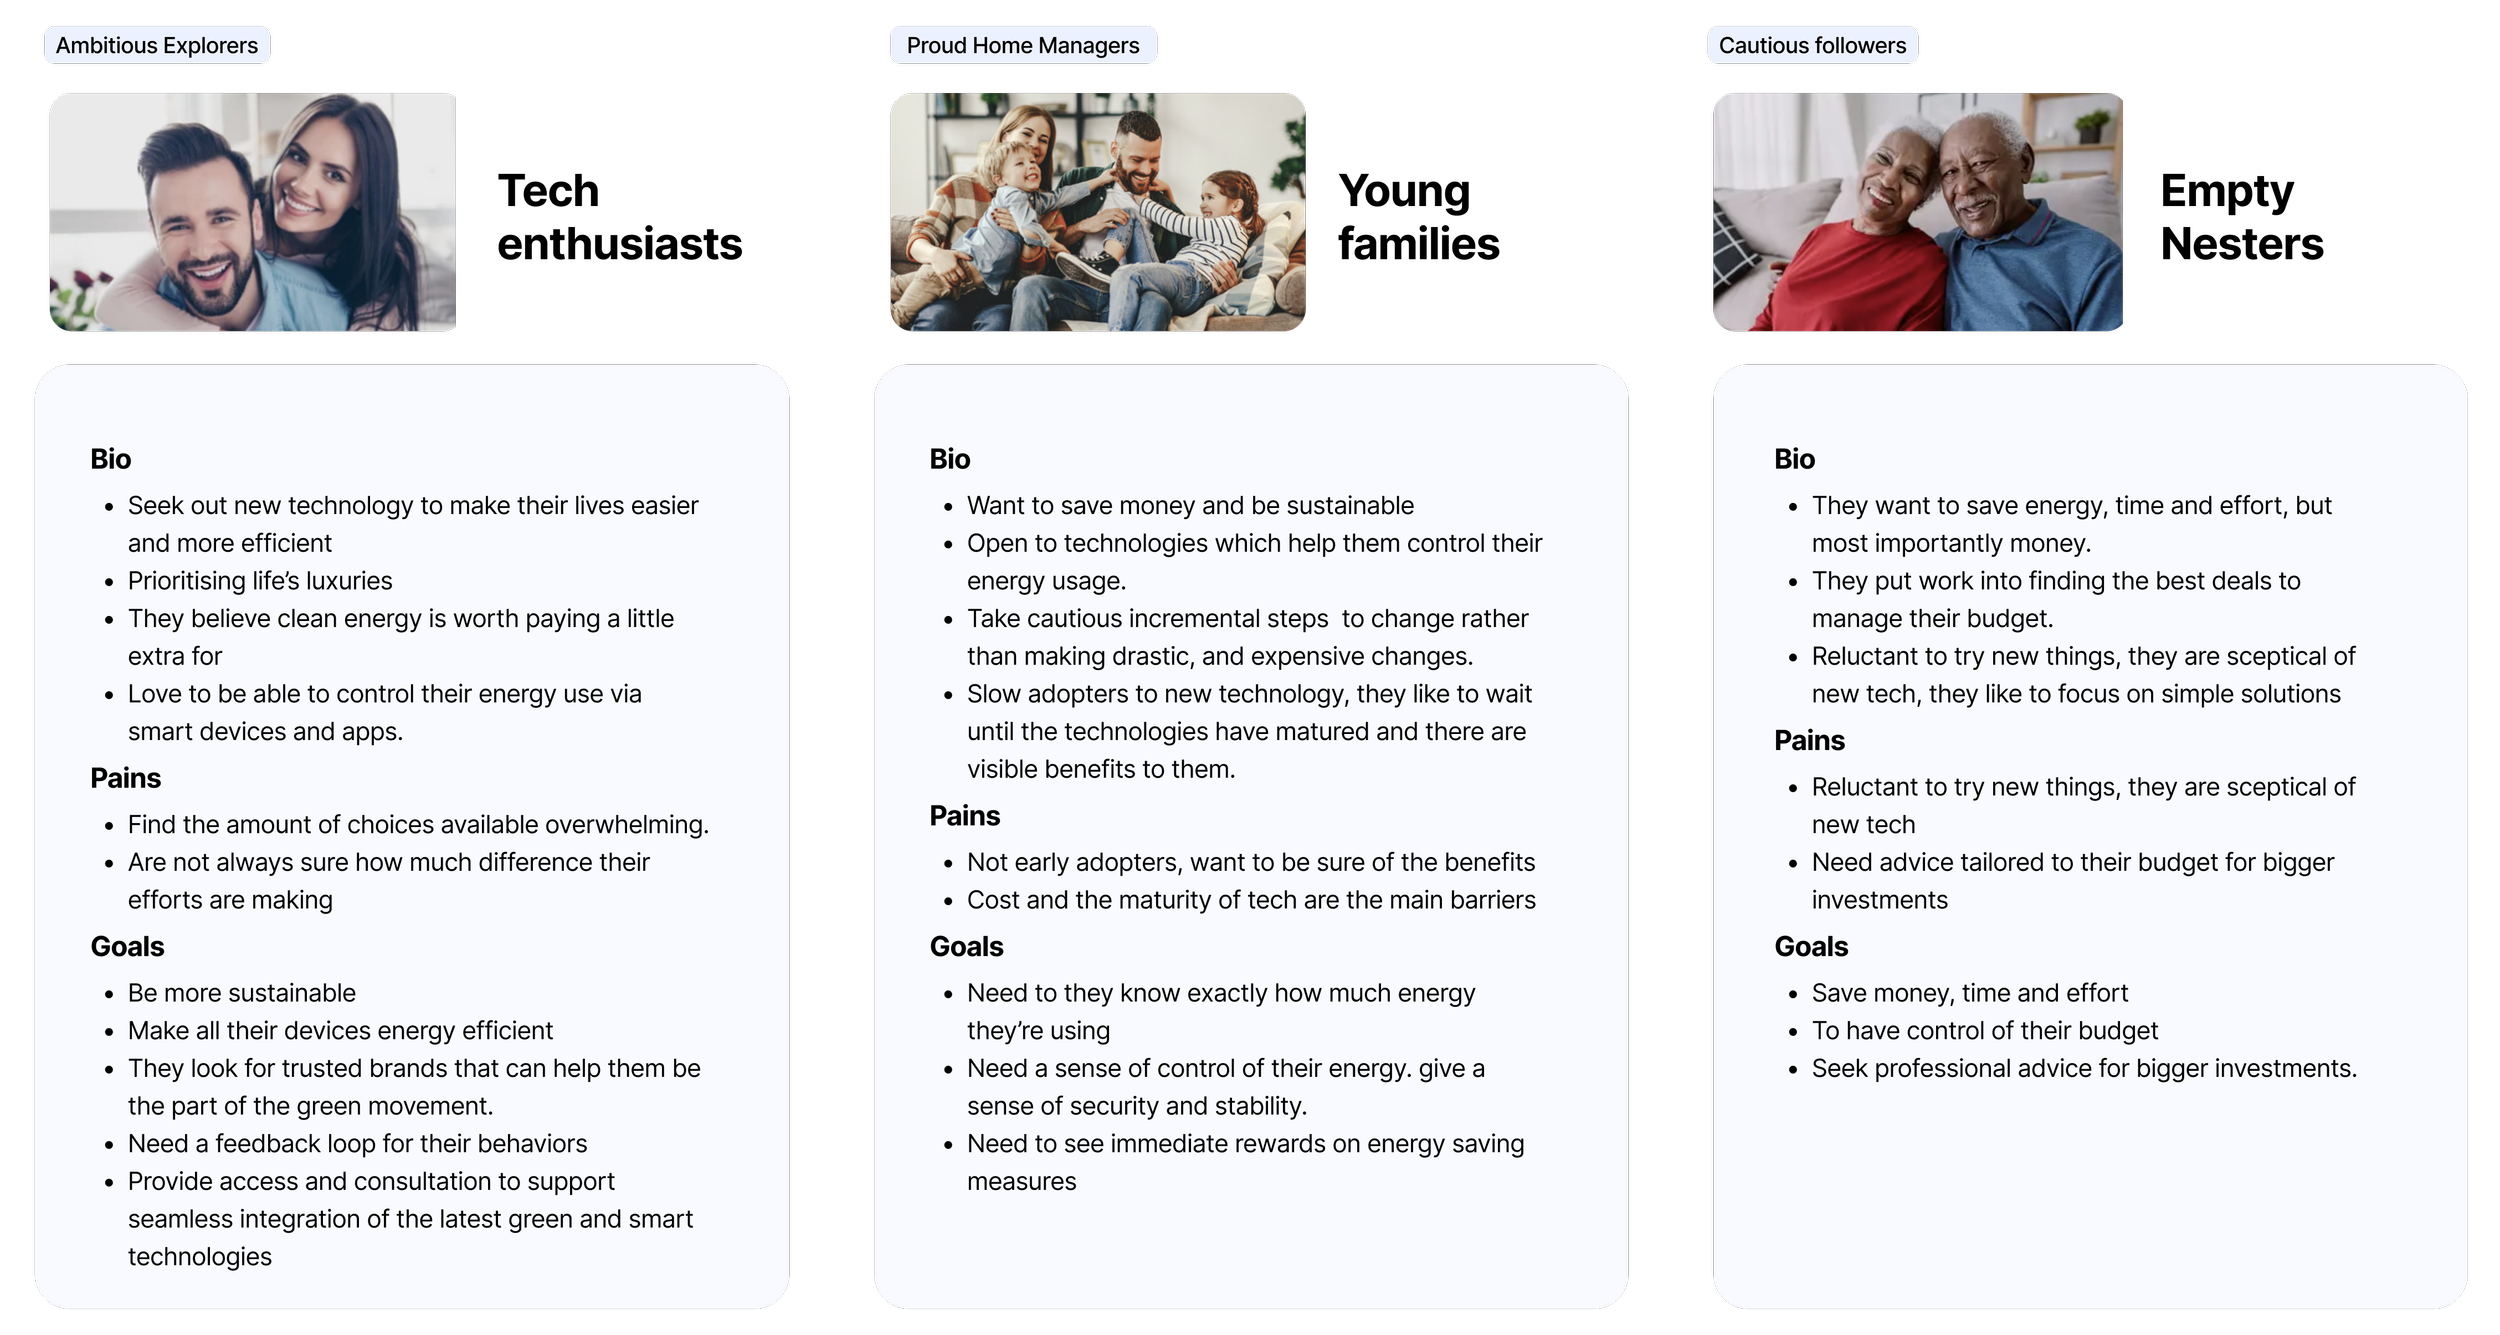
Our customers
KPI’s
Create a competitive advantage for Shell Energy Retail in the consumer market
Increase customer retention through by creating value
Enable data-driven sales to other solutions within the Shell Portfolio
Workshops

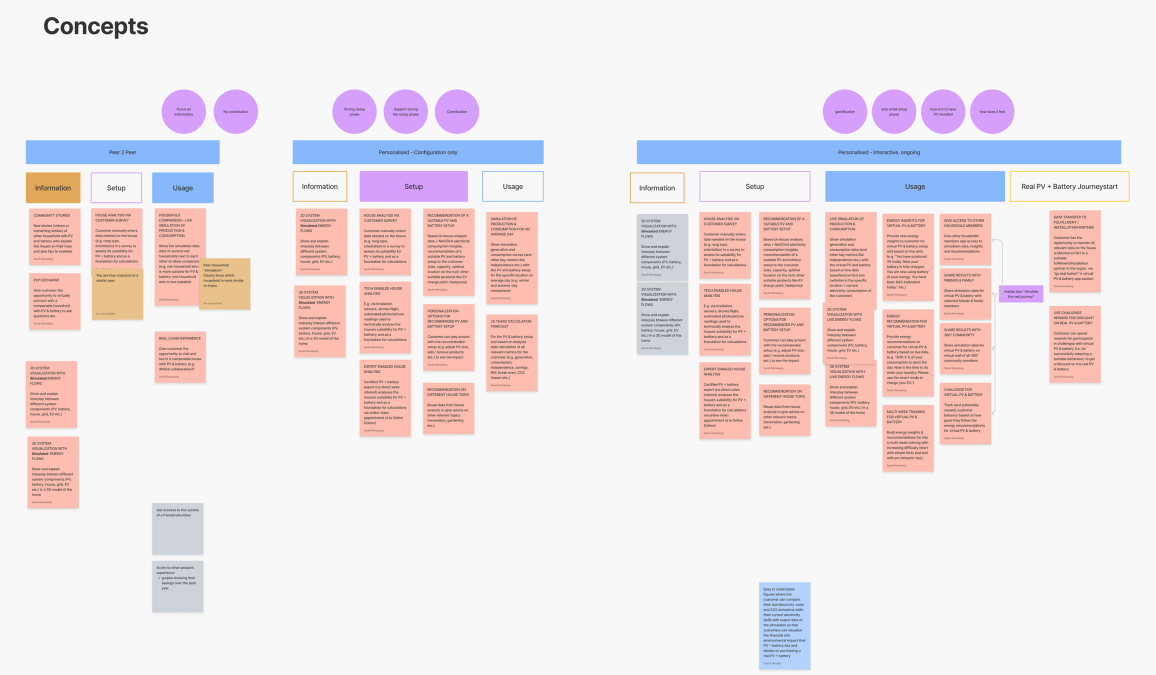
Product vision
Energy insights
To be able to provide real-time data for a user’s household, both on a total and an appliance-level. This is to provide trust transparency & control.
Try-before-buy services
This is a simulation engine using real data that would give users a chance to try out products such as solar panels, helping to provide decision guidance before a big purchase.
Challenges & rewards
A engagement feature that would motivate continued usage of the app, with potential rewards to recognise positive behaviour changes.
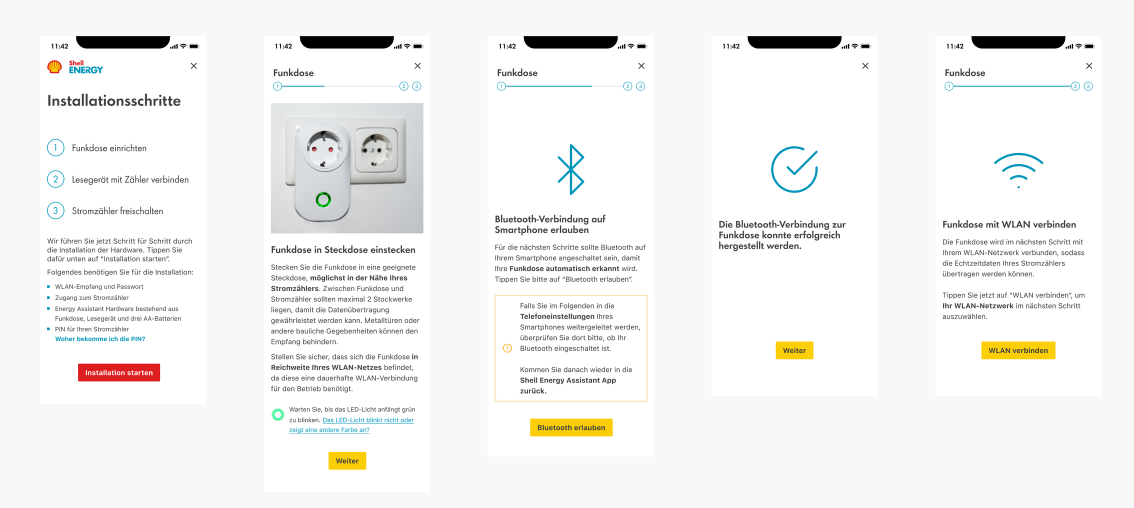
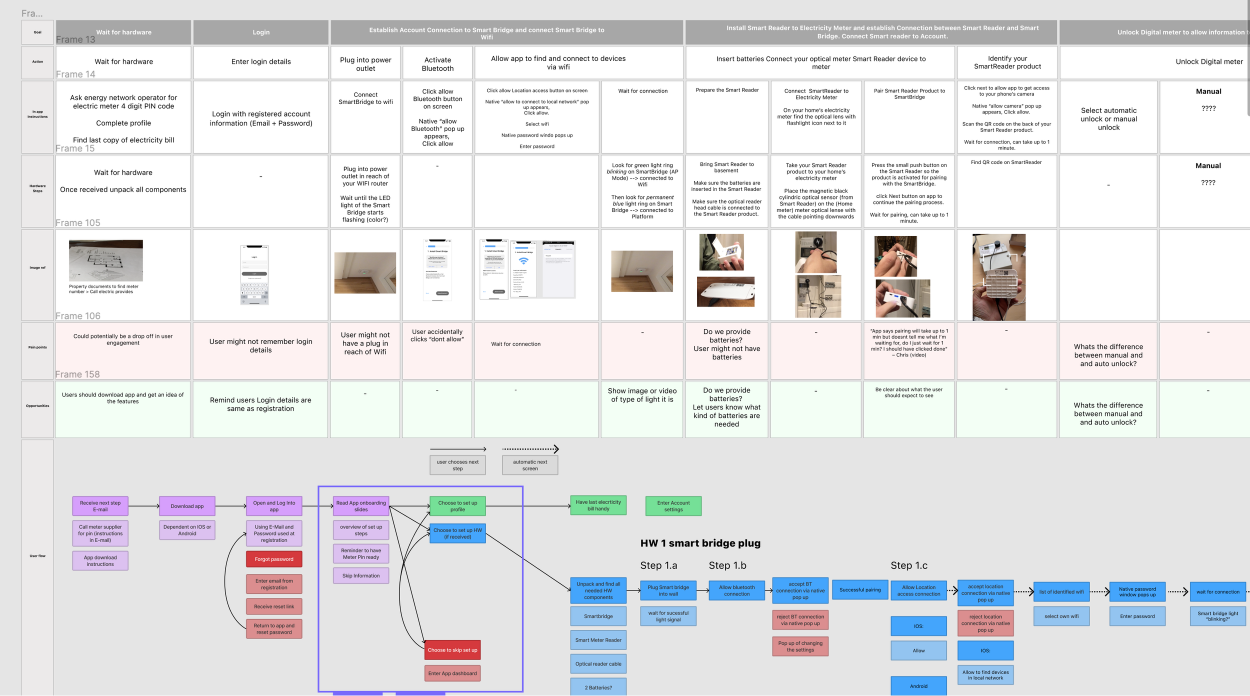
In order to gain customer electricity data they had to install a hardware device on their meter that linked to the app via bluetooth and wifi. This allowed us to convert the data into understandable information on the application.
This setup was complex, and had many opportunities for error. The journey had to be user-friendly to reduce errors during installation. We designed a comprehensive user flow for the hardware setup to ensure smooth guidance for users throughout the process and surfaced simplified information to troubleshoot errors.
Software & Hardware installation
Main features
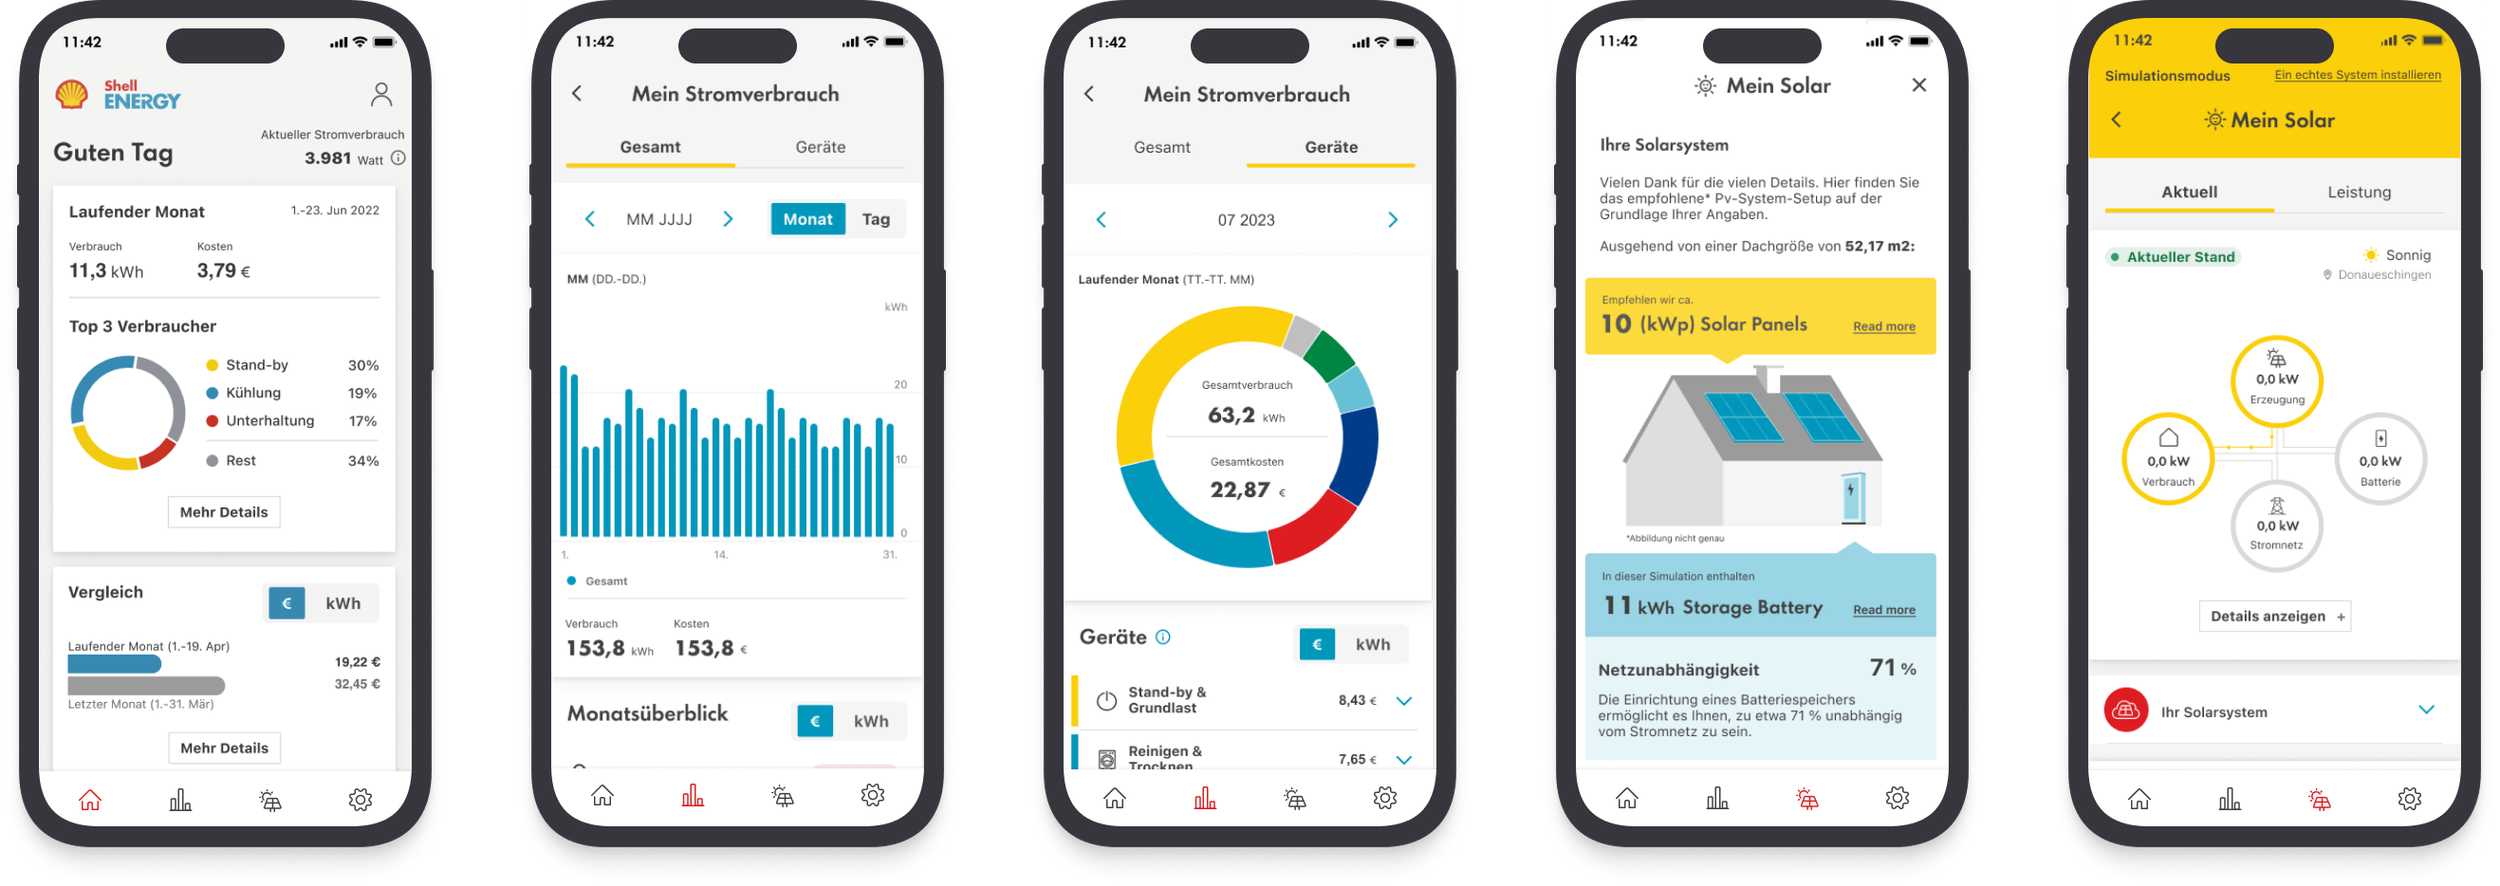
1. Energy insights
Provides real-time data for a user’s household, both on a total and an appliance-level. This is to provide trust transparency & control.
The app had 3 main features. Each feature went through a 12 week design process where we produced a design solution and tested a prototype with a small segment of customers. This allowed us to gain feedback and measure user behaviour against kpi’s. We followed a gradual release approach, introducing them to our users over time to ensure they were thoroughly tested and optimized before full implementation.
2. Virtual product simulation
Try-before-you-by simulation, using real data to give users a chance to try out products such as solar panels, to help with deciding to purchase.
3. Challenges & rewards
Actionable insights that are measured agains goals to motivate regular usage of the app, with potential rewards.
User testing
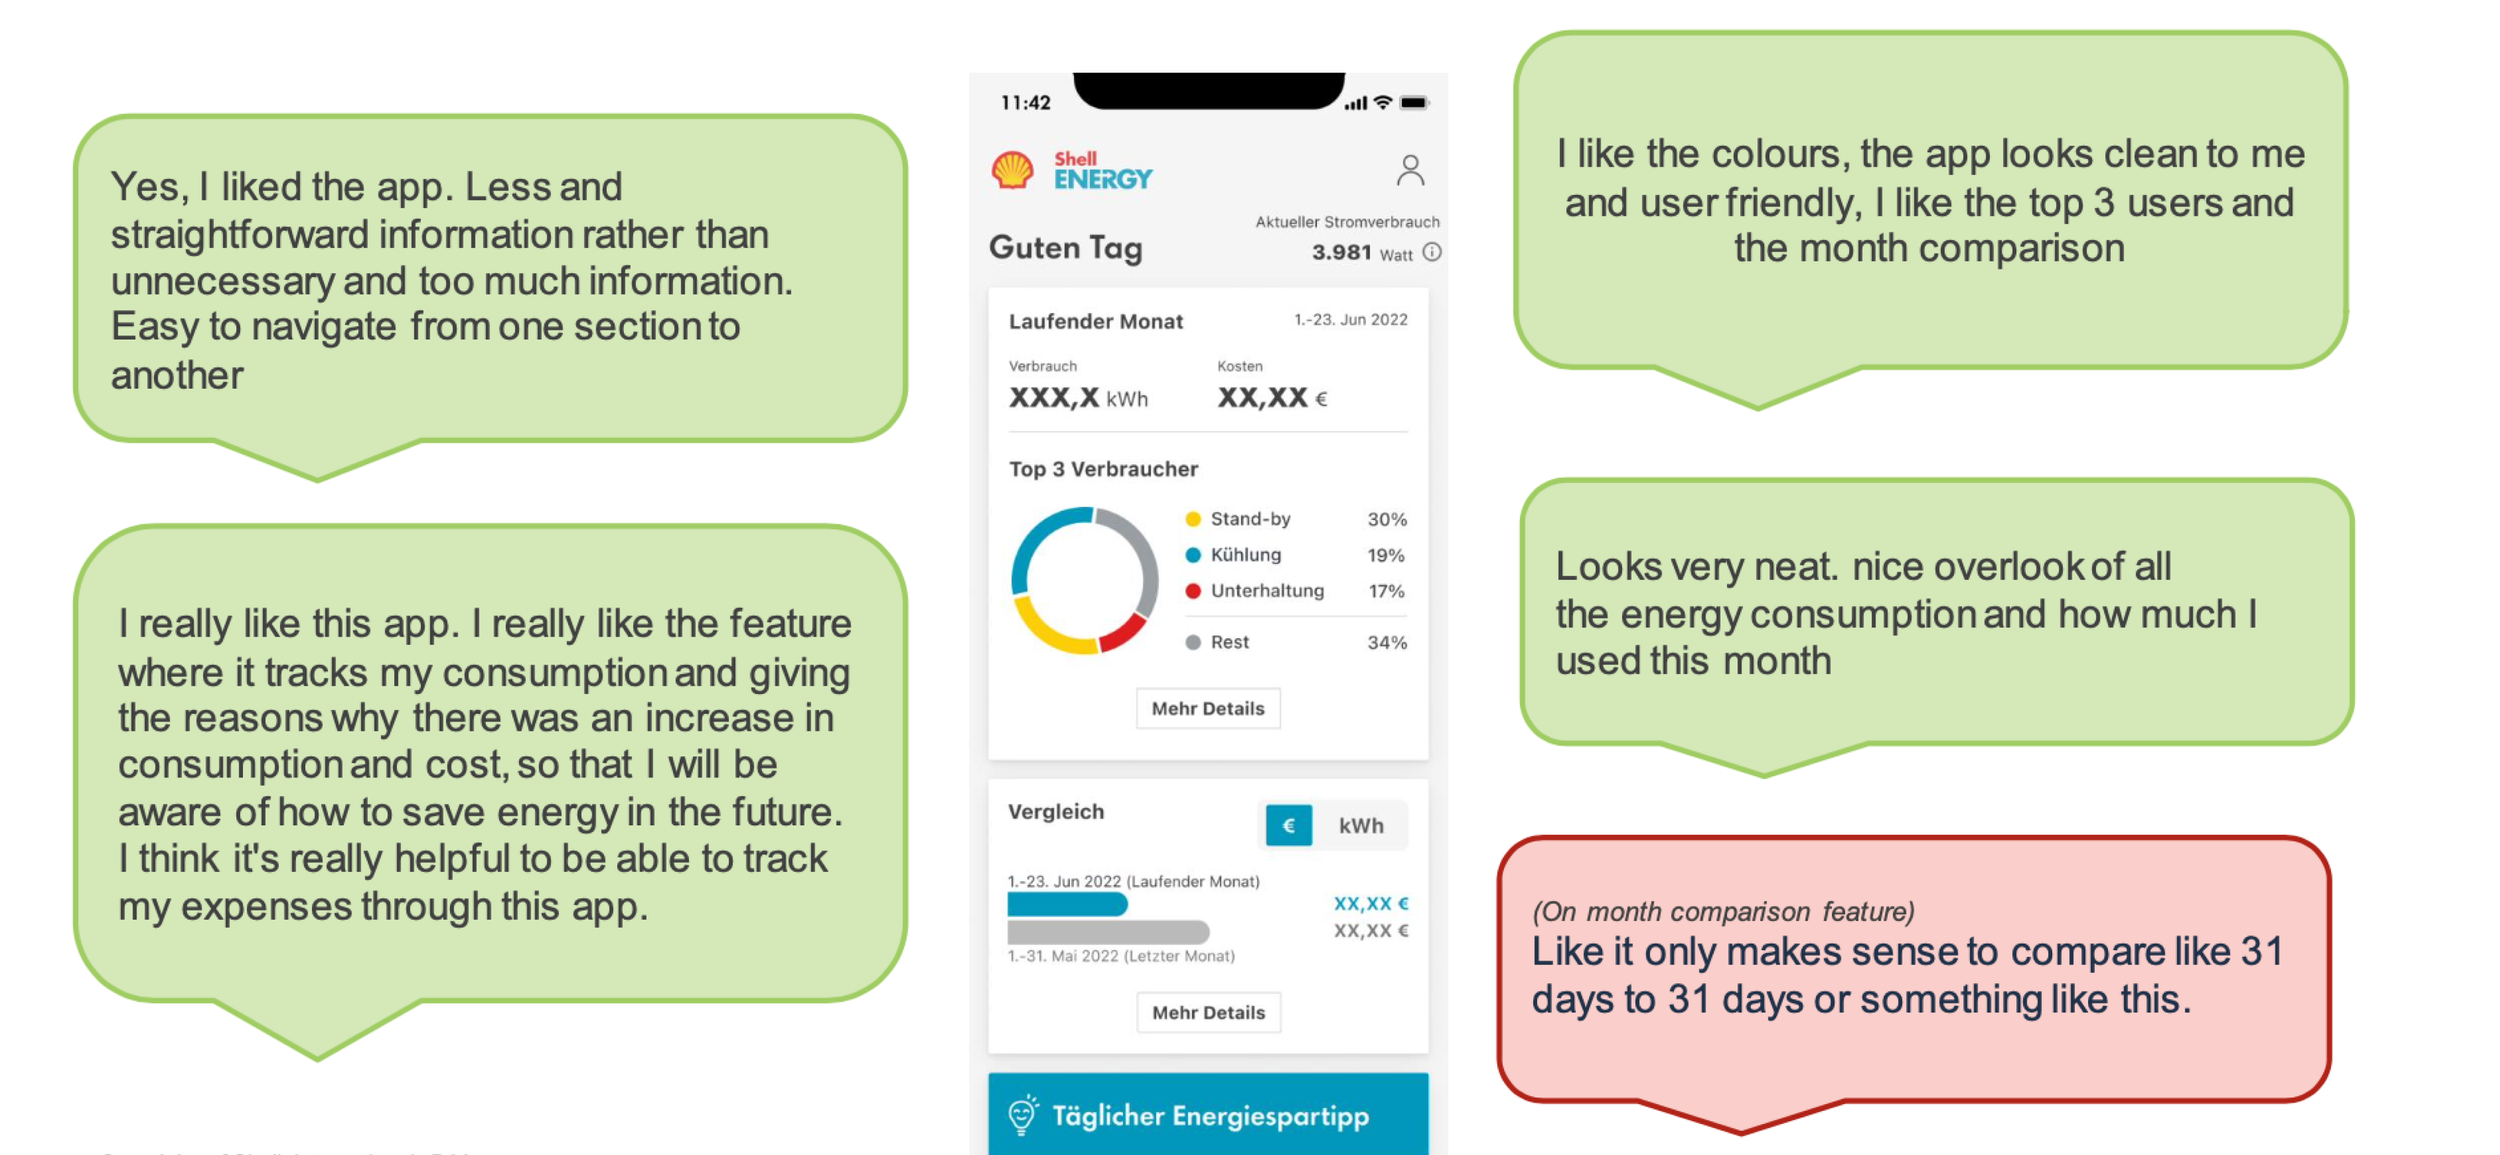
We conducted weekly qualitative user tests, both moderated and unmoderated, to validate features and itterate designs based on feedback.
From the tests we learnt that different users had distinct preferences regarding how they wished to view data, such as preferring to see their usage in kWh rather than Euros. Continuous testing allowed us to itterate and ensure that complex data was effectively communicated through simplified graphs and charts, with key insights highlighted.

Final designs
We developed a new comprehensive design system for this new app, by working closely with the Shell Energy Marketing team and adaptimg the brand guidelines. This included crafting new bespoke components and establishing design principles which led to a streamlined development workflow.
The app was launched as an alpha test to 50 Shell Energy Germany customers, yielding valuable feedback regarding its value proposition within the Shell energy portfolio along with learnings on usability and features.